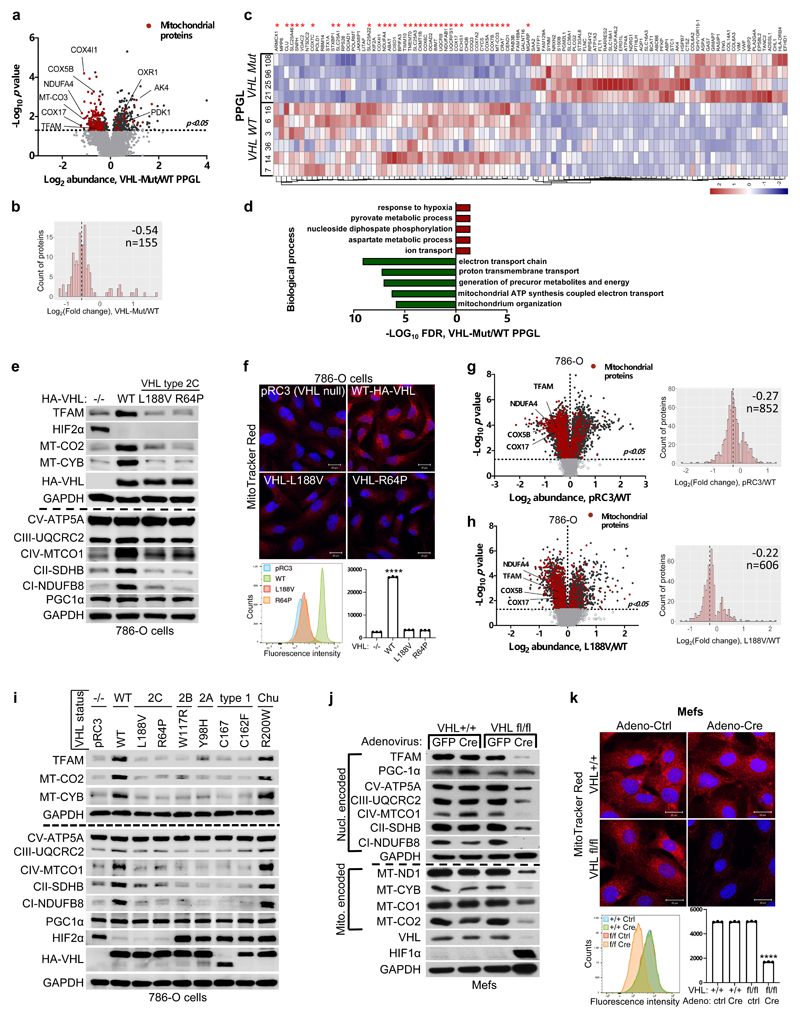
Figure 1. pVHL regulates of mitochondrial mass independent of HIFα.
a, Volcano plot of proteins detected by nanoLC-MS/MS in human PPGL tumors. (VHL mutant/ wild-type). Line indicates a p-value of 0.05 (-Log10 p value= 1.3) in two-tailed unpaired t-test. b, Histogram of mitochondrial proteins regulated in human VHL mutant compared to VHL wild-type PPGL tumors. c, Heatmap of top 50 down- and up- regulated proteins in human VHL related PPGL tumors (VHL mutant/ wild-type). Red stars indicate mitochondrial proteins. d, Top 5 biological processes of top 50 up (red)- and down (green)-regulated proteins for human VHL PPGL tumors. e, Immunoblot of 786-O cells stably expressing wildtype pVHL (WT) or type 2C pVHL mutants (L188V or R64P). n = 3 biological independent experiments. The corresponding immunofluorescence images is shown in f. Top: Cells were stained by MitoTracker Red. Bottom: Flow cytometry analysis of MitoTracker Green-stained cells. Data are presented as mean values ± SD. One way ANOVA Tukey's Multiple Comparison Test. ****p <0.0001. n = 3 biological independent experiments. g, Left: Volcano plot of proteins detected by nanoLC-MS/MS in human ccRCC cells (786-O). VHL-null cells (pRC3) were compared to VHL wild-type (WT) expressing cells. Line indicates a p-value of 0.05 (-Log10 p value= 1.3) in two-tailed unpaired t-test. Right: Histogram of fold changes of mitochondrial proteins comparing pRC3 to VHL-WT with indicted median value of Log2(Fold change) -0.27. h, Left: Volcano plot of proteins detected by nanoLC-MS/MS in 786-O cells. VHL-L188V mutant cells were compared to VHL wild-type expressing cells as in (G). Right: Histogram of fold changes of mitochondrial proteins comparing VHL-L188V to VHL-WT with indicated median value of Log2(Fold change) of -0.22. i, Immunoblot of 786-O cells stably transfected to produce the indicated pVHL species. j, Immunoblot of VHL MEFs with indicated genotype. i,j, n = 3 biological independent experiments. The corresponding immunofluorescence of VHL MEFs is shown in k. Top: Cells were stained by MitoTracker Red to visualize mitochondria. Bottom: Flow cytometry analysis of MitoTraker Green-stained MEFs. n = 3 biological independent experiments. Data are presented as mean values ± SD. One way ANOVA Tukey's Multiple Comparison Test. ****p <0.0001

