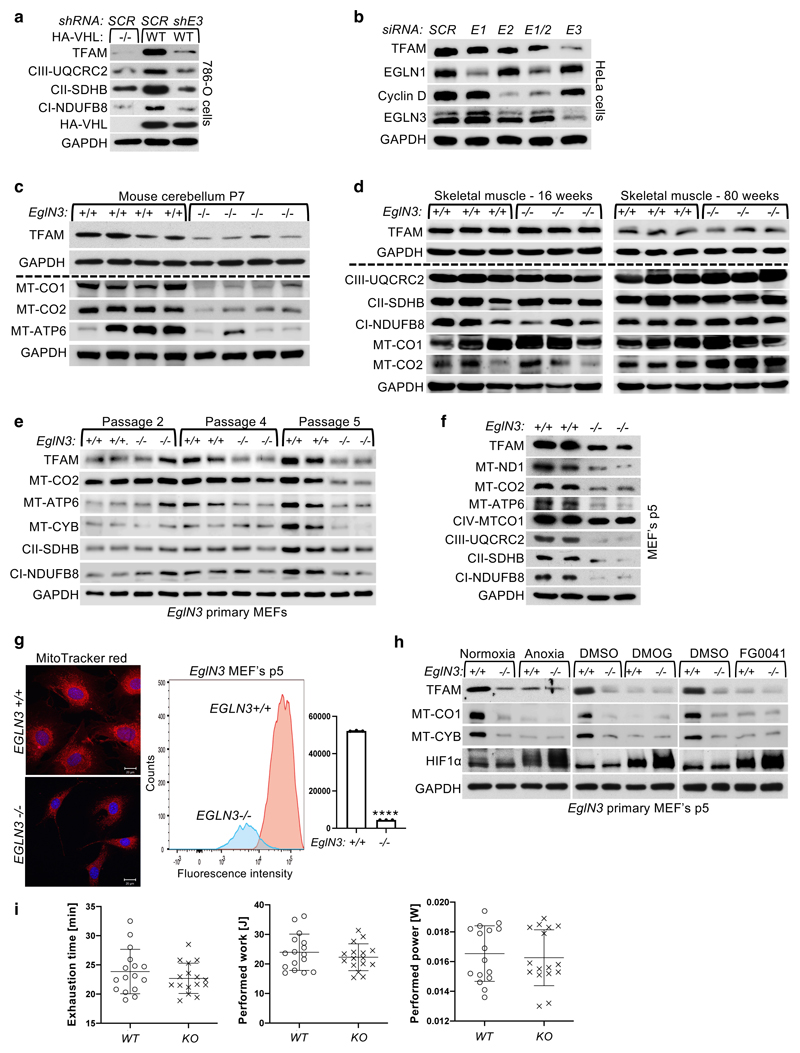
Extended Data Fig. 2. VHL regulation of mitochondrial mass is hydroxylation and EglN3 dependent.
(a) Immunoblot analysis of 786-O cells with indicated VHL status transduced with lentiviral pL.KO shRNA targeting EGLN3 (shE3) or no targeting control (SCR). n = 3 biological independent experiments. (b) Immunoblot analysis of HeLa cells transduced with lentiviral pL.KO shRNA targeting EGLN1, EGLN2, EGLN3 or no targeting control. n = 3 biological independent experiments. (c) Immunoblot analysis of mouse cerebellum of indicated genotype. n = 4 biologically independent EGLN3 wildtype or knockout mice. (d) Immunoblot analysis of mouse skeletal muscles of indicated genotype. n = 3 biologically independent EGLN3 wildtype or knockout mice. (e) Immunoblot of primary EglN3-MEFs of indicated genotype with different passages. n = 3 biological independent experiments. (f) Immunoblot analysis of primary EGLN3-MEFs of indicated genotype. n = 3 biological independent experiments. (g) Left: Fluorescence images of primary EGLN3-MEFs of indicated genotype. Mitochondria were stained by MitoTracker Red. Right: Flow cytometry analysis of MitoTracker Green-stained primary MEFs of indicated genotype. Data are presented as mean values ± S.D. Two-tailed unpaired t test. ****p <0.0001. n = 3 biological independent experiments. (h) Immunoblot of EGLN3 primary MEFs with indicated genotype upon normoxic or anoxic conditions for 16h or treated with 1 mM DMOG or 50 μM FG0041 for 8 h. n = 3 biological independent experiments. (i) In contrast young adult, KO mice (18-19 weeks of age) show a comparable exhaustion time, performed work and performed power (n=16 per genotype, male mice). Data represent means ± SD and individual measurements.

