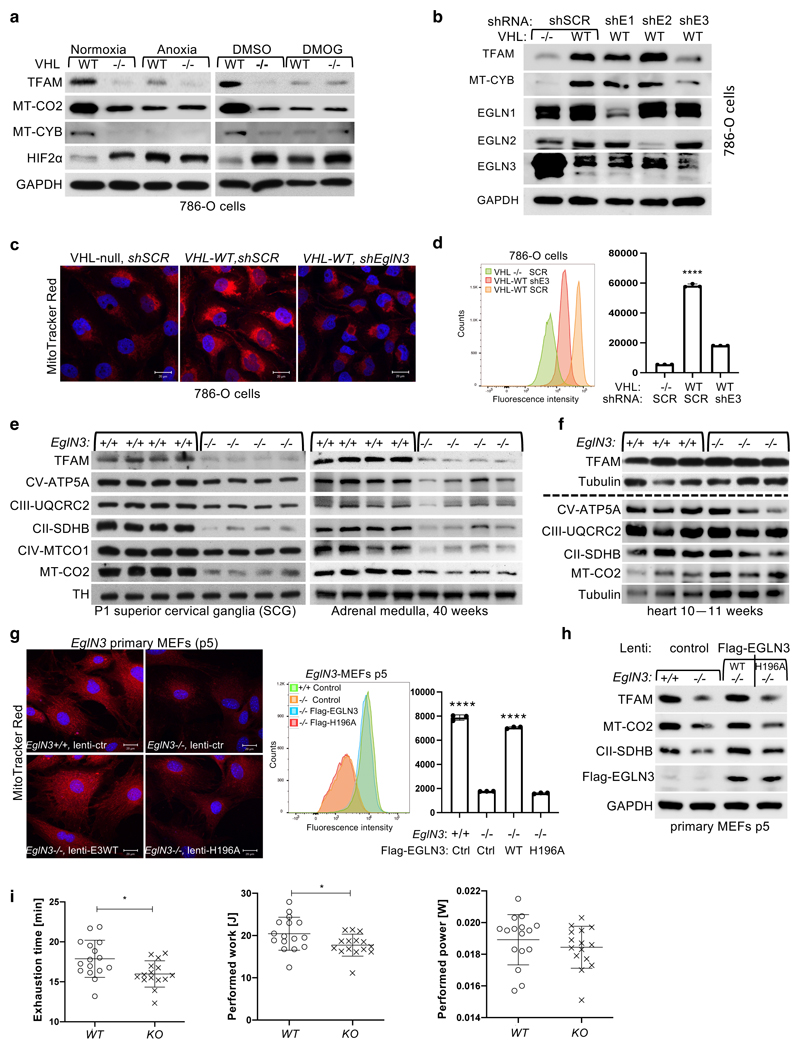
Figure 2. pVHL regulation of mitochondrial mass is hydroxylation and EGLN3 dependent.
a, Immunoblot analysis of 786-O cells with indicated genotype upon anoxic condition for 16 h or treated with 1 mM DMOG for 8 h. n = 3 biological independent experiments. b, Immunoblot analysis of 786-O cells with indicated VHL status transduced with lentiviral pL.KO shRNA targeting EGLN1 (shE1), EGLN2 (shE2), EGLN3 (shE3) or no targeting control (shSCR). n = 3 biological independent experiments. c, Fluorescence images of 786-O cells with indicated VHL status transduced with lentiviral pL.KO shRNA targeting EGLN3 or no targeting control. Mitochondria are visualized by MitoTracker Red staining. Corresponding flow cytometry analysis of MitoTracker Green-stained 786-O cells is shown in d. Data are presented as mean values ± SD. One way ANOVA Tukey's Multiple Comparison Test. ****p <0.0001. n = 3 biological independent experiments. e, Immunoblot analysis of mouse superior cervical ganglia (SCG) (left), adrenal gland medulla (right) of indicated genotype. n = 4 biologically independent EGLN3 wildtype or knockout mice. f, Immunoblot analysis of mouse heart of indicated genotype. n=3 biologically independent EGLN3 wildtype or knockout mice. g, Left: Fluorescence images of primary EGLN3 MEFs of indicated genotype stably transduced with lentivirus encoding EGLN3 WT, catalytic death mutant EGLN3-H196A or empty control. Mitochondria are visualized by MitoTracker Red staining. Right: Corresponding flow cytometry analysis of MitoTracker Green-stained primary MEFs cells of indicated genotype stably transduced with lentivirus encoding EGLN3 WT, catalytic death mutant EGLN3-H196A or empty control. n = 3 biological independent experiments. Data are presented as mean values ± SD. One way ANOVA Tukey's Multiple Comparison Test. ****p <0.0001. Corresponding immunoblot of primary EGLN3 MEFs is shown in h. n = 3 biological independent experiments. i, Aged, 56-60 weeks old KO mice reach exhaustion significantly earlier and perform less work at comparable performed power (WT n=16, KO n=15 independent biological samples per genotype, male mice). Data are presented as mean values ± SD. Two-tailed unpaired t test. p =0.014, p =0.0318.

