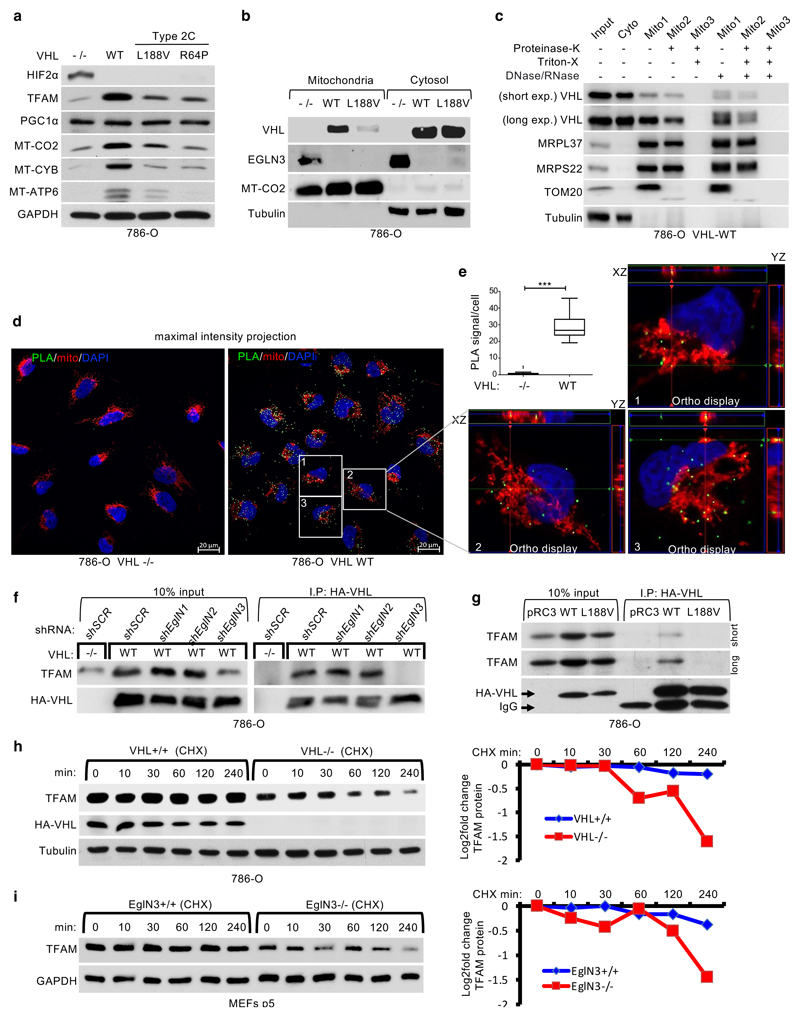
Figure 3. pVHL regulates TFAM protein stability depending on EGLN3 enzymatic activity.
a, Immunoblot of 786-O cells stably transfected to produce the indicated pVHL species. b, Immunoblot analysis of mitochondrial and cytosolic fractions of 786-O stable cells. c, Immunoblot analysis of subcellular fractionation of 786-O pVHL wild-type (WT) cells. Mitochondrial fractions were treated with 25 μg/ml Proteinase K with or without 1% Triton X-100. a-c, n = 3 biological independent experiments. d, Representative confocal images of in situ proximity ligation assay (PLA) between TFAM and pVHL in 786-O cells with indicated VHL status. PLA signal is shown in green, DAPI (blue) and MitoTracker Red (red) in maximal intensity projection. Orthogonal view of three cells identified in pVHL expressing cells are presented and demonstrate co-localization of PLA signal in mitochondria (yellow). Magnification 63x; scale bar: 5 μm. e, Quantification of the number of PLA signals per cell in both conditions with indicated VHL status; Mann-Whitney U test; *** P value <0.001. (n >200 cells per group examined). Similar results were seen more than three times. The term five-number summary is used to describe a list of five values: the minimum, the 25th percentile, the median, the 75th percentile, and the maximum. These are the same values plotted in a box-and-whiskers plot when the whiskers extend to the minimum and maximum. f, Immunoblots of HA-VHL immunoprecipitation from 786-O cells transduced with lentivirus encoding shRNA targeting EGLN1, EGLN2, EGLN3 or scramble control (SCR). g, HA-VHL immunoprecipitation from 786-O cells with stable expression of either HA-VHL wild-type (WT) or HA-VHL-L188V. Immunoblots showing co-immunoprecipitation of endogenous TFAM and HA-VHL. h, Left: 786-O VHL-null cells (-/-) or stable HA-VHL wild-type (WT) expressing cells were treated with 10 μg/ml cycloheximide (CHX). At the indicated time points, whole-cell lysates were prepared for immunoblot analysis. Right: Corresponding quantification of the band intensities. i, Left: EGLN3 MEFs with indicated genotype were treated with cycloheximide (CHX) at the concentration of 10 μg/ml and whole-cell lysates were prepared for immunoblot analysis at the indicated time points. Right: Corresponding quantification of the band intensities. f-i, n = 3 biological independent experiments.

