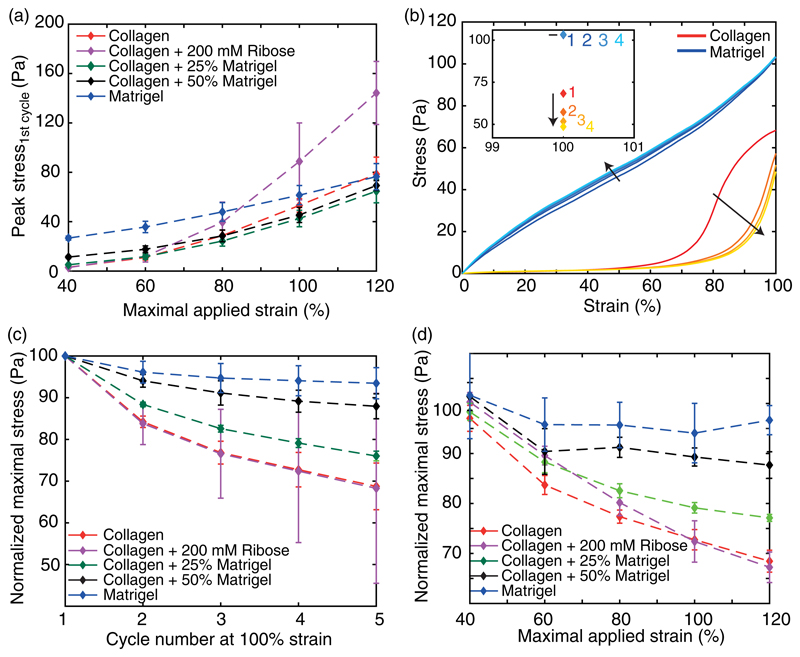
Fig. 5. Strain- and cycle-dependent maximal load.
(a) Development of the peak stress with increasing maximal strain for all studied hydrogels. (b) Representative corrected loading curves of collagen and Matrigel at 100% strain. Here, the cycle number of the loading curves is indicated by the color of the curve. While the dark red and blue correspond to the first cycle, the saturation decreases with increasing cycle number. The inset highlights the corresponding cycle-dependent development of the peak stress at 100% strain. (c) and (d) The normalized maximally reached stress depending on cycle number at 100% strain (c) and the maximal strain of the first cycle (d).

