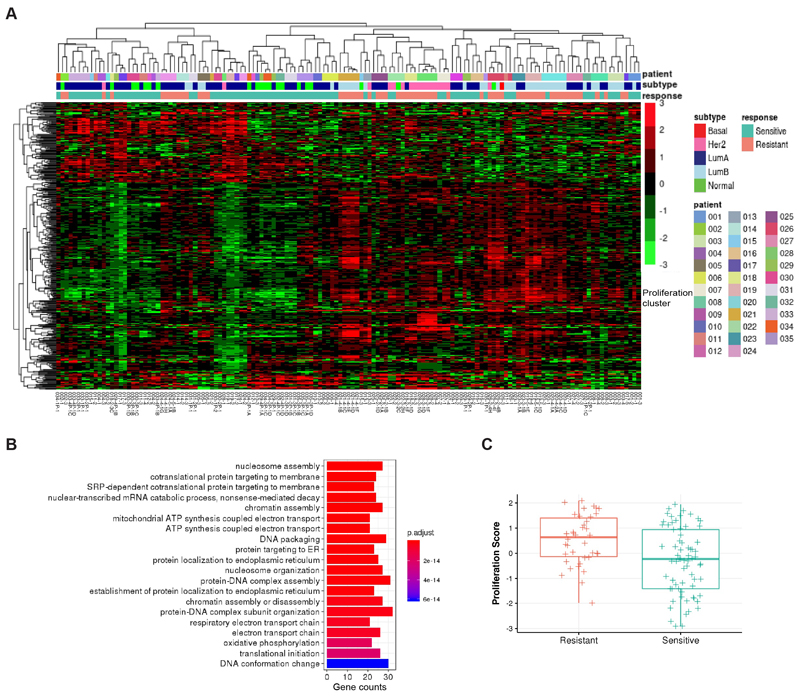
Figure 3. Differential gene expression in resistant tumors.
A, Hierarchical clustering of batch corrected RNA gene expression of significantly differentially expressed genes in resistant tumors (N=24 from 17 patients) compared to matched sensitive tumors (N=29 from 17 patients) using linear mixed models. B, Gene ontology terms associated with up-regulated genes in resistant tumors. C, Boxplot indicating median score and inter-quartile range of proliferation scores in resistant and sensitive tumors.

