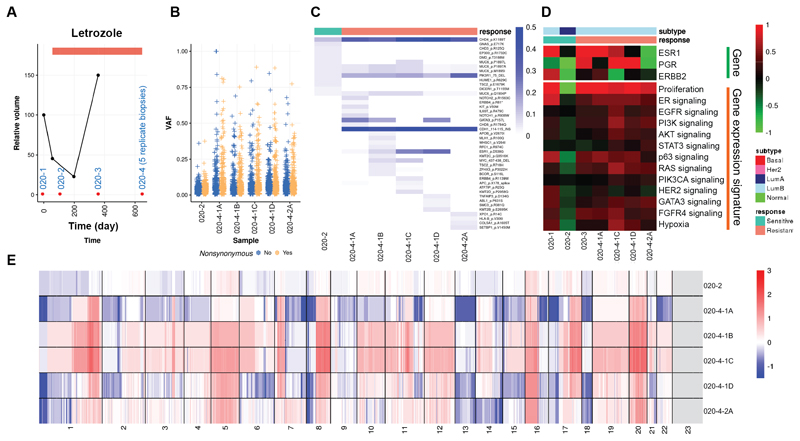
Figure 5. Molecular portraits of a luminal patient with acquired endocrine resistance.
A, Line plot showing tumor volume change indicating resistance to endocrine therapy acquired for the last two samples. Red dots indicate timing for tissue sampling. B, Box plots indicating median score and inter-quartile range of VAF of detected variants stratified by synonymous and nonsynonymous variants. C, Heatmap showing VAF of nonsynonymous variants of Pan-Cancer drivers. D, Heatmap showing gene expression of hormone receptors and key signaling pathways. E, Heatmap showing copy number landscapes of all tumors from the patient.

