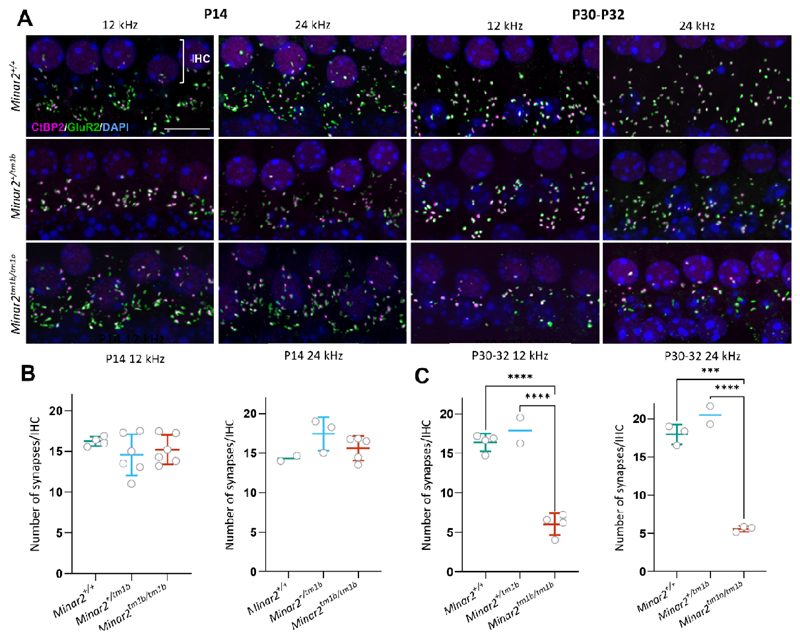
Figure 5. Synaptic abnormalities of cochlear hair cells in Minar2 mutant mice.
(A) Synapses were examined using anti-CtBP2 antibody to mark pre-synaptic ribbons (magenta) and anti-GluR2 antibody to mark postsynaptic densities (green). Nuclei are shown in blue (DAPI). Scale bar = 5 µm. The images correspond to the cochlear best-frequency regions of 12 kHz and 24 kHz. The row of nuclei at the top of each image corresponds to the IHCs. (B, C) Quantification of ribbon synapses per IHC at P14 (B) and P30-P32 (C). Colocalised pre and postsynaptic components were defined as a synapse. The average for each mouse is plotted as a circle. All data are shown as mean ± SD and statistically analyzed by one way ANOVA with multiple comparisons. At P14, no significant difference was seen between homozygotes (n = 6 at 12 kHz and n = 5 at 24 kHz) and heterozygotes (n = 6 at 12 kHz and n = 3 at 24 kHz) or wildtypes (n=4 at 12 kHz and n = 2 at 24 kHz). At P30-P32, there are significantly fewer colocalised synapses in Minar2tm1b/tm1b (n = 4 for 12 kHz and n = 3 for 24 kHz) compared to wildtypes (n = 4 at 12 kHz and n = 3 at 24 kHz) and compared to heterozygotes (n = 2). *** p =0.0001 and **** p < 0.0001

