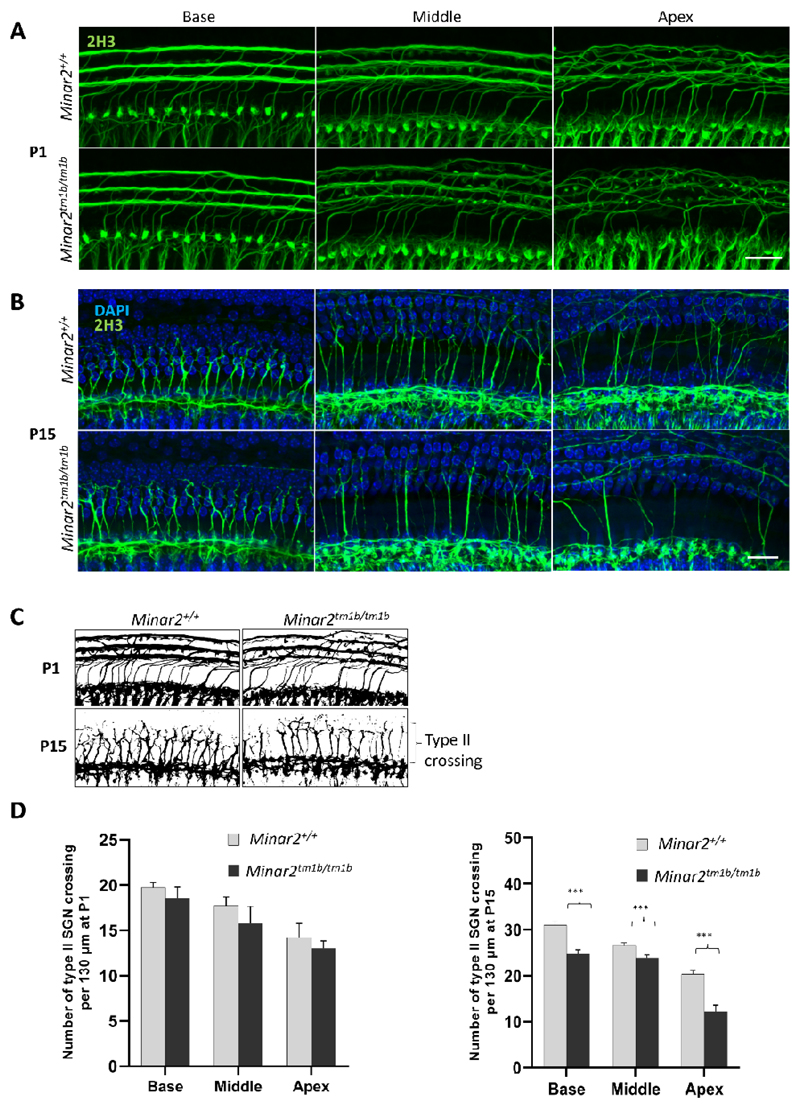
Figure 7. Confocal maximum intensity projection images from 24 kHz region of the whole-mount cochlea.
(A and B) Total innervation with anti-2H3 Neurofilament label (green) for P1 and P14 (N=3 each group) wild type and mutant mice; scale bar A and B =20 µm (C) Schematic diagram of whole mount cochlea demonstrating the innervation pattern of type II nerves at P1 and P14 wild type and mutant mice. (D) The total number of crossings of type II nerves is show as histogram (n=3; *** P<0.001.)

