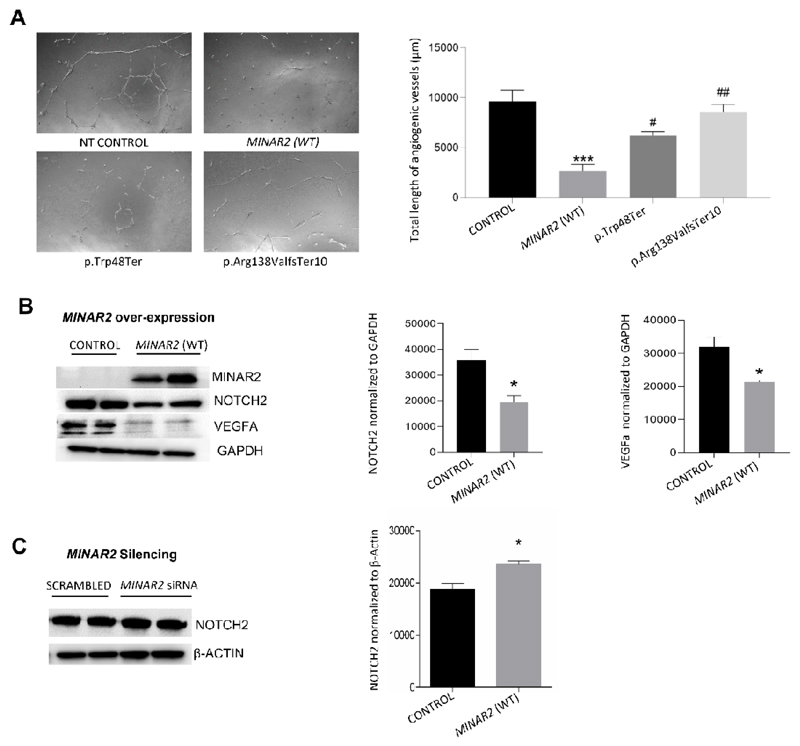
Figure 8. Effects of MINAR2 on angiogenesis, NOTCH2 and VEGFA.
(A) Angiogenic potential of non-transfected (NT) HUVEC compared to cells transfected with MINAR2 wildtype (WT), and MINAR2 p.Trp48* and p.Arg138Valfs*10 plasmid constructs. Right graph shows analysis of total length of angiogenic vessels formed after incubation of 12 hrs on Matrigel coated wells; images were analyzed with imageJ angioanalyzer and results are expressed as mean±SEM. Significant differences were shown as *** (p≤0.001) when compared to control and as ## (p ≤0.01) when compared to MINAR2(WT). (B) Left: immunoblot images showing the effect of MINAR2(WT) transient overexpression on NOTCH2 and VEGFA protein levels in HUVEC cells; Right: statistical analysis of GAPDH-normalized relative protein expressions of NOTCH2 and VEGFA. Results are expressed as mean±SEM and significant differences are shown as *(p≤0.05) when compared to control. (C) Left: immunoblot images of siRNA-induced MINAR2 silencing on NOTCH2 protein levels in PC12 cells; Right: beta-actin-normalized relative protein expression of NOTCH2. Results are expressed as mean±SEM and significant differences are shown as *(p≤0.05) when compared to control. Data analyzed by one way ANOVA with multiple comparisons.

