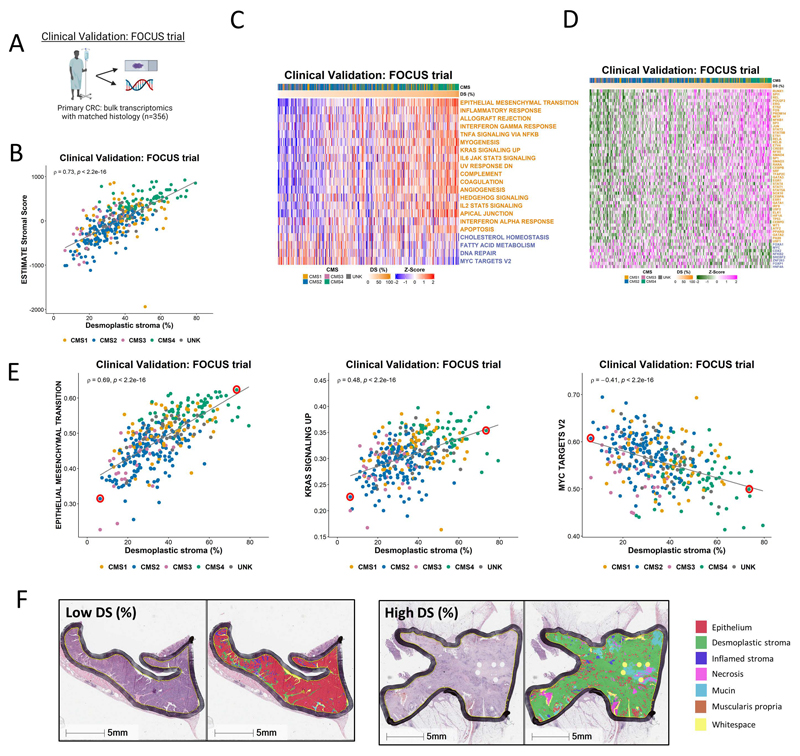
Figure 4. Application of findings to bulk CRC tumor data.
A Schematic summary of the clinical validation dataset from the FOCUS clinical trial. B Scatterplot showing correlation between desmoplastic stroma percentage determined from H&E assessment and ESTIMATE Stromal Score determined by transcriptomic data in the FOCUS clinical trial samples (Spearman’s rho = 0.73, p < 2.2e-16), colored by Consensus Molecular Subtype (CMS) calls (CMS1: n=62; CMS2: n=155; CMS3: n=29; CMS4: n=66; UNK: n=44). C Heatmap of ssGSEA scores for the Hallmark gene sets (identified in Figure 2 as significantly enriched in the stroma/epithelium in the LCM discovery and validation cohorts) for the FOCUS clinical trial samples. Samples ranked in order of desmoplastic stroma percentage (DS%) from lowest (left) to highest (right). Gene sets with names colored orange were significantly enriched in stroma in the LCM discovery and LCM validation cohorts and gene sets with names colored blue were significantly enriched in epithelium in the LCM discovery and LCM validation cohorts. D Heatmap of activity scores for transcription factors (identified as significantly enriched in the stroma/epithelium in the LCM discovery and validation cohorts) for the FOCUS clinical trial samples. Samples are arranged in order of desmoplastic stroma percentage (DS%) from lowest (left) to highest (right). Gene sets with names colored orange were significantly enriched in stroma in the LCM discovery and LCM validation cohorts and gene sets with names colored blue were significantly enriched in epithelium in the LCM discovery and LCM validation cohorts. E Scatterplots showing the correlation between desmoplastic stroma percentage determined from H&E and ssGSEA scores for the Epithelial Mesenchymal Transition (left) (Spearman’s rho = 0.69, p < 2.2e-16), KRAS Signaling Up (middle) (Spearman’s rho = 0.48, p < 2.2e-16) and MYC Targets V2 (right) (Spearman’s rho = -0.41, p < 2.2e-16) Hallmark gene sets. We identified two cases representative of low and high desmoplastic stromal percentage in each of these analyses (red circles). F H&E along with HALO mark-up for the representative low and high desmoplastic stromal percentage samples identified in E.

