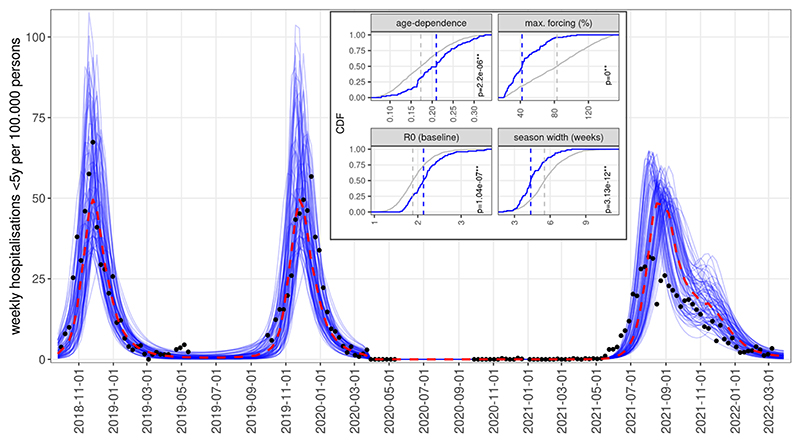
Fig. 4.
Simulations of RSV resurgence from June 2021, assuming gradual recovery of contact levels from March 2021, showing the 10% of simulations with the lowest error with respect to SARI-Watch hospitalisation rates. Inset: Cumulative density functions of parameters for all simulations accepted for matching pre-NPI RSV epidemiology (grey) versus the subset of accepted simulations that also replicated the early resurgence (blue). Dashed lines show median values for the two distributions; p-values are from Kolgomorov-Smirnov tests.

