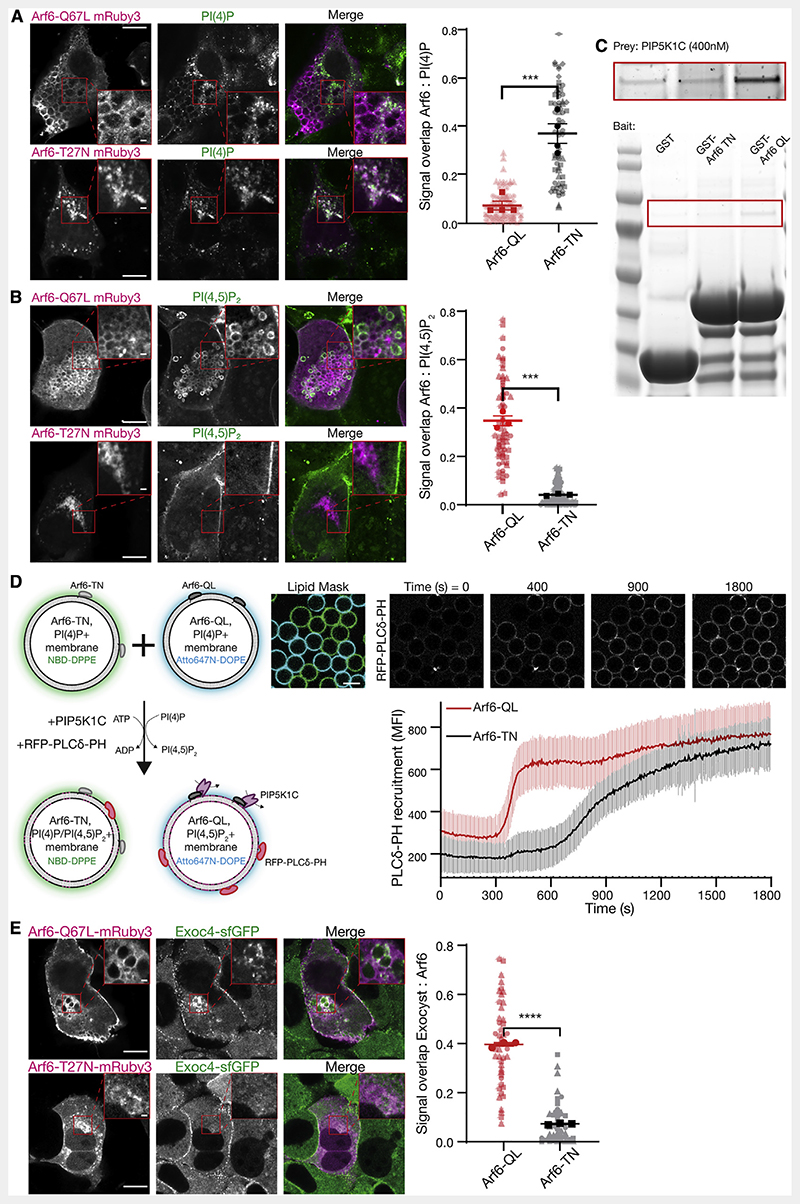
Figure 5. Arf6 controls PI(4,5)P2 conversion and exocyst recruitment.
(A and B) NMuMG cells were transfected with Arf6-Q67L or Arf6-T27N tagged with mRuby3, and subsequently fixed, permeabilized, and stained against either PI(4)P or PI(4,5)P2 using purified SidC or PLCδ-PH fused to GFP, respectively. Signal overlap between channels was determined using the ImageJ plugin Squassh. Plot shows biological repeats (in bold) with individual cells (in background); n = 3-4 repeats with 29-36 individual cells each. Asterisks denote p < 0.001. Scale bar, 10 μm; inset, 1 μm.
(C) Purified GST, GST-Arf6-T27N or GST-Arf6-Q67L were bound to resin as bait, and purified PIP5K1C (400 nM) used as prey. Inset (top) is increased contrast.
(D) Membrane-coated beads harboring PI(4)P and either recombinant Arf6-T27N or Arf6-Q67L were distinctly labeled with NBD-DPPE or Atto647N-DOPE and mixed. PIP5K1C (12.5 nM) was added, and the recruitment of purified PLCδ-PH fused to RFP was measured overtime. Beads were segmented using either the NBD or Atto647N signal as masks. Plot is mean fluorescent intensity of recruited PLCδ-PH ± standard deviation, quantified in ImageJ. n = 92-99 beads. Scale bar, 10 μm.
(E) NMuMG cells expressing endogenously sfGFP-tagged Exoc4 were transfected with Arf6-Q67L or Arf6-T27N fused to mRuby3 and imaged using Airyscan confocal microscopy. Signal overlap between channels was determined using the ImageJ plugin Squassh. n = 3 repeats with 7-25 individual cells each; asterisks denote p < 0.001. Scale bar, 10 μm; inset, 1 μm.
See also Figure S3.

