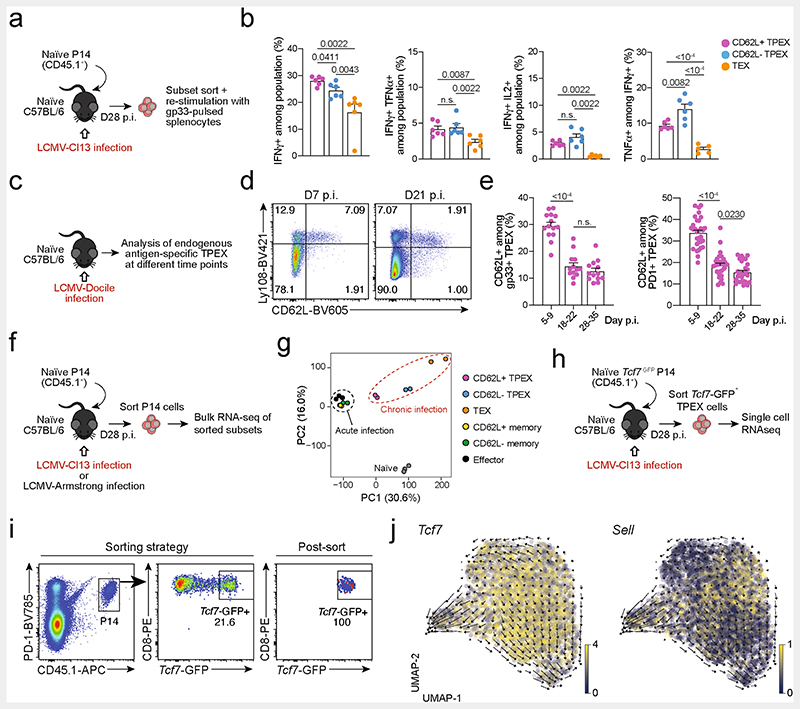
Extended Data Fig. 2. Functional and transcriptional profiling of exhausted T cell subsets and RNA velocity analysis showing that differentiation streams originate from CD62L+ TPEX cells.
(a, b) Congenically marked naive P14 T cells were adoptively transferred into naive recipient mice, which were then infected with LCMV-Cl13. Splenic P14 T cells from each group were sorted at day 28 post-infection and restimulated independently using gp33-pulsed splenocytes in vitro. (a) Schematic of the experimental set-up. (b) Quantifications showing cytokine production of each subset after restimulation. (c–e) Wild-type mice were infected with LCMV-Docile and splenic CD8+ T cells were analysed at the indicated time points after infection. (c) Schematic of the experimental set-up. (d) Flow cytometry plots showing the expression of CD62L in TPEX (Ly108hi) and TEX (Ly108lo) cells among endogenous gp33-specific CD8+ T cells. (e) Quantification showing the proportions of CD62L-expressing cells among gp33+ TPEX cells (left) and polyclonal PD-1+ TPEX cells (right) at the indicated time points after infection (f, g) Congenically marked naive P14 T cells were adoptively transferred into naive recipient mice, which were then infected with LCMV-Cl13 or LCMV-Armstrong. Splenic P14 compartments from each group were sorted at 28 dpi and processed for bulk RNA-seq. (f) Schematic of the experimental set-up. (g) Principal component plot showing the transcriptional landscapes of sorted populations as indicated. (h–j) Congenically marked naive Tcf7-GFP P14 T cells were adoptively transferred into naive mice, which were then infected with LCMV-Cl13. P14 TPEX cells were sorted at day 28 post-infection based on the expression of Tcf7-GFP. (h) Schematic of the experimental set-up. (i) Flow cytometry plots showing the sorting strategy and post-sort purity. (j) RNA velocity analysis showing developmental trajectories of TPEX cells, together with the expression of Tcf7 (left) and Sell (right). Horizontal lines and error bars of bar graphs indicate mean and s.e.m., respectively. Data are representative of two independent experiments (b) and all analysed mice (e). P values are from Mann–Whitney tests (b) and two-tailed unpaired t-tests (e); P > 0.05, not significant (n.s.).

