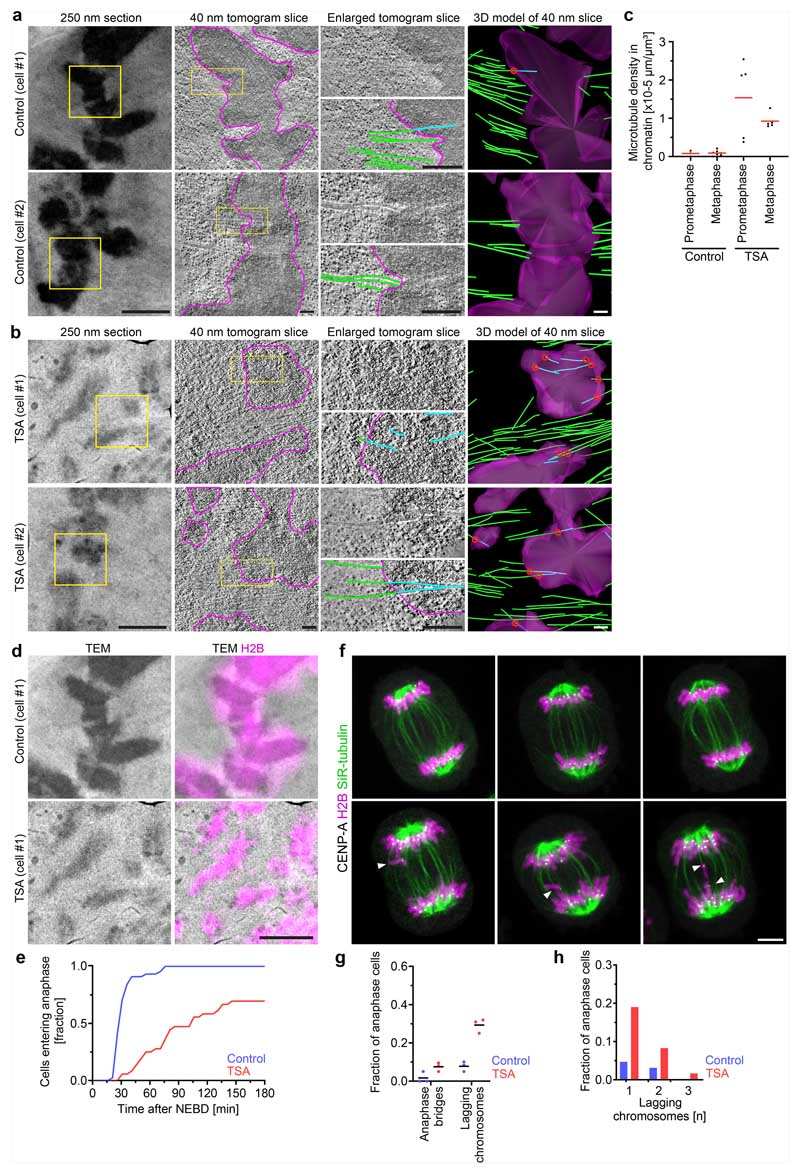
Extended Data Fig. 6. Correlative fluorescence and electron microscopy of mitotic cells and analysis of chromosome segregation by live imaging after TSA treatment.
a, b, Electron tomograms of prometaphase WT Hela cells, untreated (a) or treated with TSA (b). Magenta: chromatin surfaces; green: microtubules in cytoplasm; cyan: microtubules in chromatin; red circles: microtubule perforation sites at chromosome surface. Representative example regions for control prometaphase (n = 3), control metaphase (n = 7), TSA prometaphase (n = 5) and TSA metaphase (n = 5); example regions are from 10 tomograms per condition from 7 different cells each. c, Quantification of microtubule density in chromatin regions of prometaphase or metaphase cells in the absence or presence of TSA. Data shown in Fig.1e, f separated by mitotic stage, n = 10 tomograms from 7 different cells for each condition. Bars indicate mean. d, Correlative transmission electron microscopy and fluorescence microscopy of chromatin/H2B-mCherry in prometaphase WT Hela cells (related to a, control cell #1 and b, TSA cell #1). e, Mitotic progression analysis by time-lapse microscopy of HeLa cells expressing H2B-mRFP, in untreated control and TSA-treated cells. n = 44 for control from 5 biological replicates, n = 36 for TSA from 4 biological replicates. Time is relative to nuclear envelope disassembly (NEBD). f, Chromosome missegregation analysis by Airyscan imaging of live anaphase HeLa cells expressing H2B-mCherry and meGFP-CENP-A and stained with SiR-tubulin. Representative images of n = 64 control cells and n = 110 TSA-treated cells. Single Z-sections. g, Quantification of chromosome missegregation of cells as illustrated in f. Dots indicate biological replicates, bars indicate mean. n=64 cells for control, n = 110 for TSA. h, Quantification of number of lagging chromosomes in cells as illustrated in f. Fraction of cells with 1, 2, or 3 lagging chromosomes. n = 64 cells for control, n = 110 for TSA. Biological replicates: n = 2 (a–h). Scale bars, a,b, 250 nm section, 2 μm; tomogram slices and 3D model, 200 nm; d, 2 μm; f, 5 μm.

