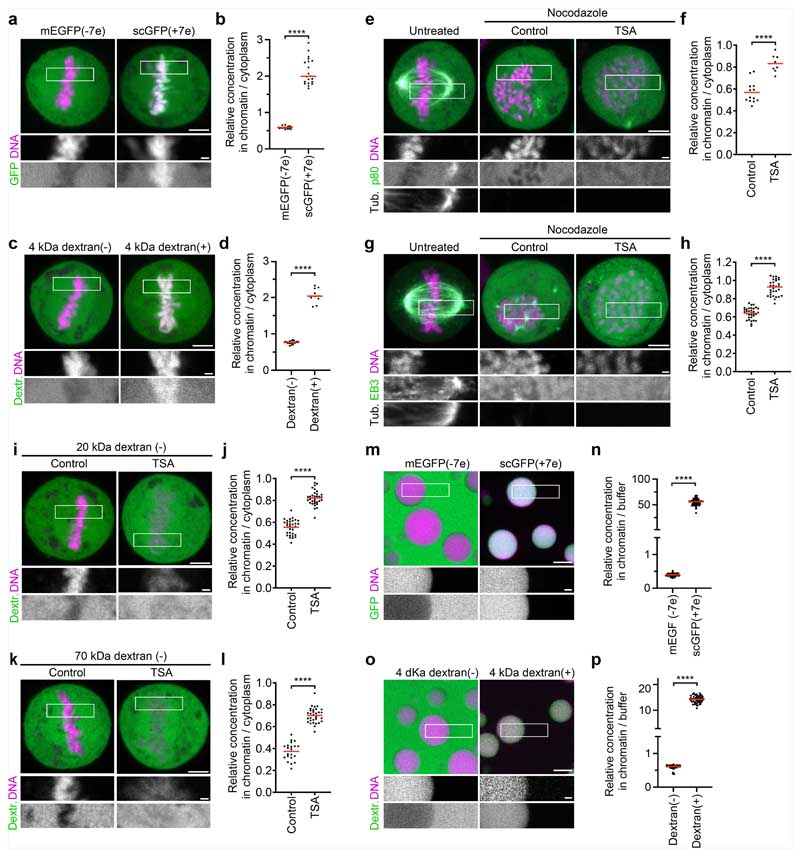
Extended Data Fig. 9. Partitioning of proteins and dextrans relative to mitotic chromatin and synthetic nucleosome array condensates.
a, b, Partitioning of GFP surface charge variants relative to chromatin in metaphase cells. a, Live metaphase cells after injection of recombinant mEGFP(−7e) or scGFP(+7e). DNA was stained with Hoechst 33342. b, Quantification of GFP fluorescence in chromatin relative to cytoplasm. n = 17 for mEGFP(−7e), n=20 for scGFP(+7e). Bars indicate mean; significance tested by a two-tailed Mann-Whitney test (P = 1.257x10⁻¹⁰). c, d, Partitioning of charge-modified fluorescent dextrans relative to chromatin in metaphase cells. c, Live metaphase cells after injection of negatively or positively charged 4.4 kDa FITC-dextrans. DNA was stained with Hoechst 33342. I, Quantification of dextran fluorescence in chromatin relative to cytoplasm. n = 21 for 4.4 kDa FITC-dextran(−), n = 10 for 4.4 kDa FITC-dextran(+). Bars indicate mean; significance tested by a two-tailed Mann-Whitney test (P = 4.509x10⁻⁸). e–h Partitioning of microtubule-associated proteins (MAPs) with mitotic chromatin in the absence and presence of TSA. DNA was stained with Hoechst 33342 and microtubules with SiR-Tubulin. e, HeLa cells expressing p80-Katanin-mNeongreen were treated with nocodazole and TSA for 3 h as indicated and imaged live. Single confocal Z-sections. f, Quantification of p80-Katanin-mNeongreen fluorescence in mitotic chromatin relative to cytoplasm. n = 13 cells for control, n = 8 for TSA. Bars indicate mean, significance was tested by a two-tailed Mann-Whitney test (P = P = 3.931x10⁻⁵). g, HeLa cells expressing EB3-mNeongreen were treated with nocodazole and TSA for 3 h as indicated and imaged live. Single confocal Z-sections. h, Quantification of EB3-mNeongreen fluorescence in mitotic chromatin relative to cytoplasm. n = 33 cells for control, n = 31 for TSA. Bars indicate mean, significance was tested by a two-tailed Mann-Whitney test (P<10−15, precision limit of floating-point arithmetic). i–l, Partitioning of negatively charged higher molecular weight dextrans relative to mitotic chromatin in the absence and presence of TSA. DNA was stained with Hoechst 33342. i, Live metaphase cells after injection of 20 kDa FITC-dextran. j, Quantification of dextran fluorescence in mitotic chromatin relative to cytoplasm. n = 33 for control, n = 33 for TSA. Bars indicate mean; significance tested by a two-tailed Mann-Whitney test (P<10−15, precision limit of floating-point arithmetic). k, Live metaphase cells after injection of 70 kDa FITC-dextran. l, Quantification of dextran fluorescence in mitotic chromatin relative to cytoplasm. n = 22 for control, n = 33 for TSA. Bars indicate mean; significance tested by a two-tailed Mann-Whitney test (P = 4x10⁻¹⁴). m, n, Partitioning of GFP surface charge variants relative to nucleosome array condensates in vitro. m, Chromatin condensates were formed in vitro by exposing 12X601 nucleosome arrays to phase separation buffer. GFP charge variants were added for 10 minutes and then imaged. DNA was stained with Hoechst 33342. n, Quantification of GFP fluorescence in chromatin relative to buffer. n =69 for mEGFP(−7e), n = 73 for scGFP(+7e). Bars indicate mean; significance tested by a two-tailed Mann-Whitney test (P<10−15, precision limit of floating-point arithmetic). o, p, Partitioning of charge modified dextrans relative to liquid nucleosome array condensates in vitro. o, Liquid chromatin droplets were formed were formed as in m. Charge modified 4.4 kDa dextrans were added for 10 minutes and then imaged. DNA was stained with Hoechst 33342. p, Quantification of dextran fluorescence in chromatin relative to buffer. n = 69 for 4.4 kDa dextran(-), n = 57 for 4.4 kDa dextran(+). Bars indicate mean; significance tested by a two-tailed Mann-Whitney test (P<10−15, precision limit of floating-point arithmetic). Biological replicates: n = 2 (a–h, m–p); n = 3 (i–l). Scale bars, 5 μm, inserts 1 μm.

