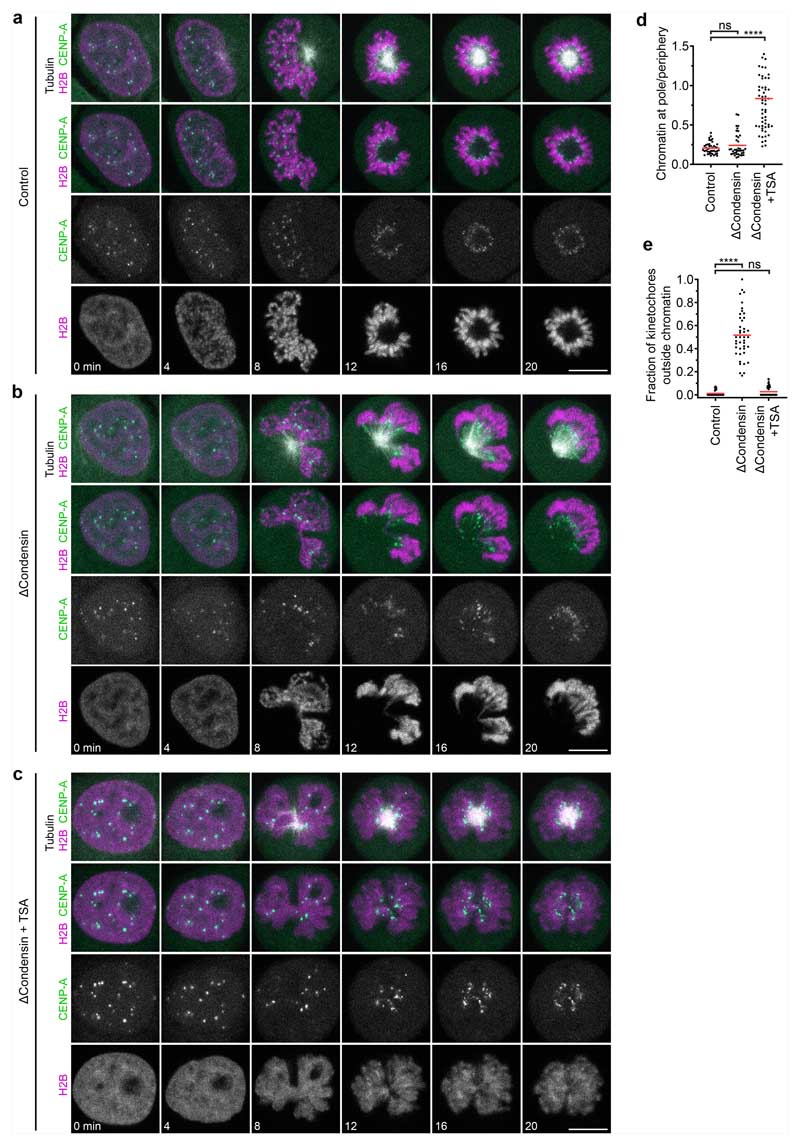
Extended Data Fig. 2. Chromosome and spindle organization in condensin-depleted and TSA-treated cells entering mitosis.
a–c, 3D confocal time-lapse microscopy of live HeLa cells entering mitosis in the presence of STLC to induce monopolar spindle geometry. Cells have homozygous Smc4-mAID-Halo alleles and stably express OsTIR(F74G), H2B-mCherry, and CENP-A-meGFP and are stained with SiR-tubulin. Images show projection of 2 Z-sections with Z-offset of 2.5 μm, centred around the spindle pole. a, Mitotic entry of a control cell. b, Cell entering mitosis after treatment with 5-PhIAA to deplete Smc4 (ΔCondensin). c, Cell entering mitosis after treatment with 5-PhIAA to deplete Smc4 and TSA to suppress mitotic histone deacetylation (ΔCondensin+TSA). d, Quantification of chromatin distribution relative to spindle monopole of cells in a-c 20 min after prophase onset. Total H2B-mCherry fluorescence in pole-proximal region divided by total H2B-mCherry-fluorescence of pole-distal regions. n = 42 cells for control, n = 38 for ΔCondensin, n = 60 for ΔCondensin+TSA. Bars indicate mean, significance was tested by a two-tailed Mann-Whitney test (ΔCondensin, P = 0.988; ΔCondensin+TSA, P<10−15, precision limit of floating-point arithmetic). e, Quantification of fraction of kinetochores outside chromatin (>0.5 μm distance from chromatin surface) of cells as in a–c 20 min after prophase onset. n = 42 cells for control, n = 42 for ΔCondensin, n = 62 for ΔCondensin+TSA. Bars indicate mean, significance was tested by a two-tailed Mann-Whitney test (ΔCondensin, P<10−15, precision limit of floating-point arithmetic; ΔCondensin+TSA, P = 0.061). Biological replicates: n = 2 (a,c–e); n = 3 (b). Scale bars, 10 μm.

