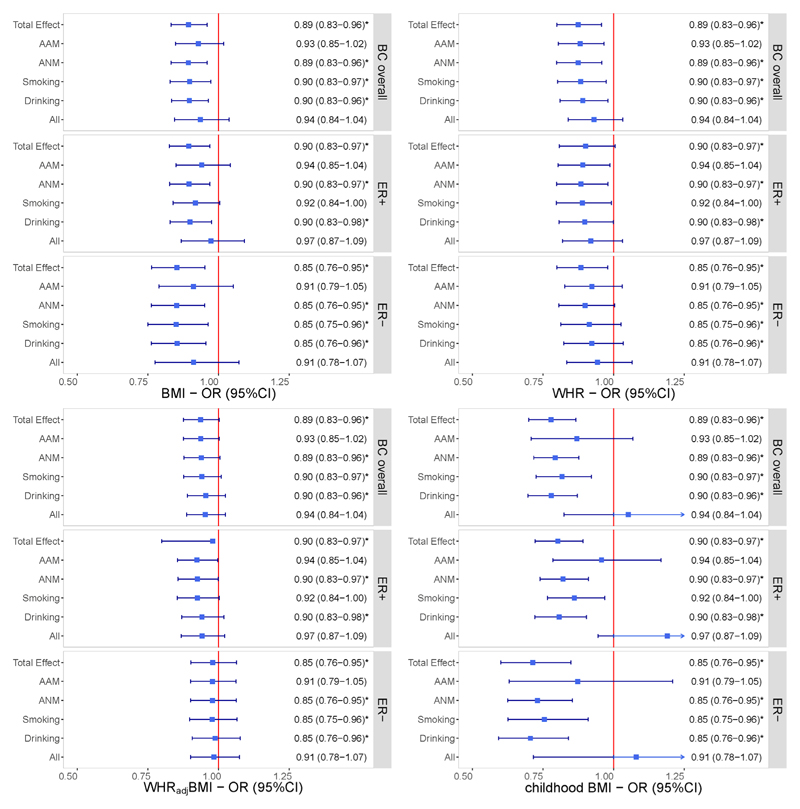
Figure 3.
Independent effects of genetically predicted obesity-related traits on the risk of BC after adjusting for each confounder separately and together using multivariable Mendelian randomization. The y-axis details the genetically predicted confounder(s) for which adjustment was made, and the x-axis details the ORs and 95%CIs per 1-standard deviation (SD) increase in exposure. Asterisks (*) denote statistical significance survived false discovery rate (FDR) correction (PFDR <0.05). Total effect refers to the estimate derived from UVMR.
Abbreviations: BMI, body mass index; WHR, waist-to-hip ratio; WHRadjBMI, waist-to-hip ratio adjusted for body mass index; BC, breast cancer; ER, estrogen receptor; AAM, age at menarche; ANM, age at natural menopause; OR, odds ratio; 95%CI, 95% confidence interval.

