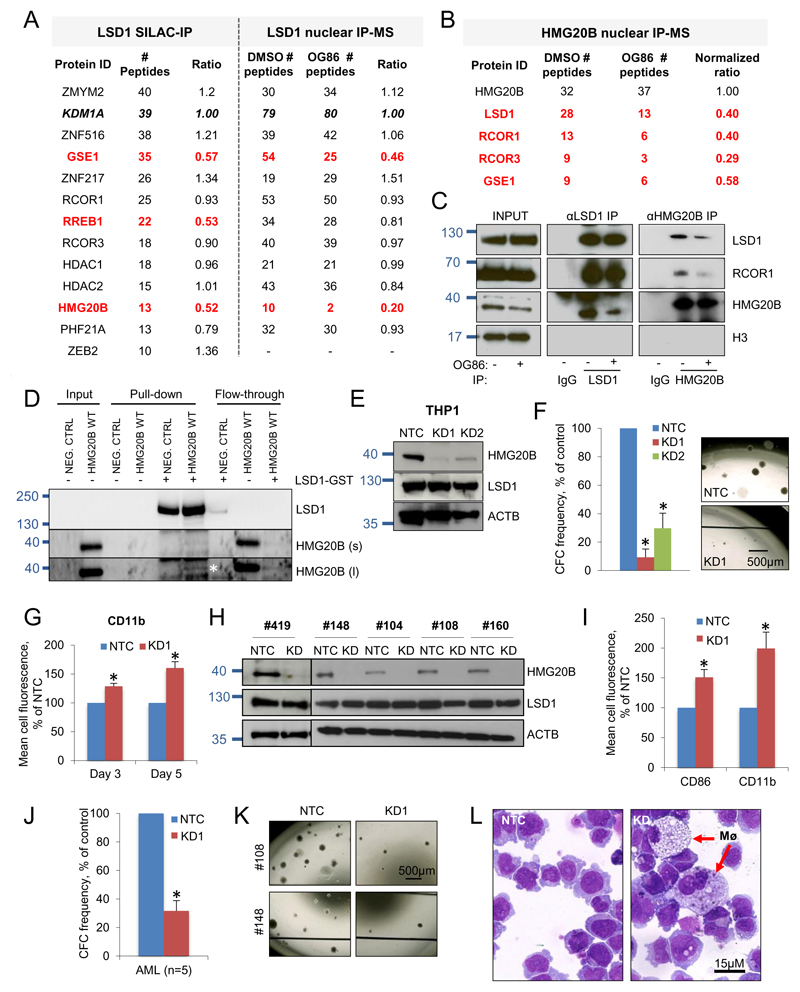
Figure 1. Pharmacological inhibition of LSD1 destabilizes its interaction with HMG20B.
(A-C) THP1 AML cells were treated with 250nM OG86 or DMSO vehicle for 48 hr. Proteins known to form part of an LSD1-containing complex and identified by mass spectrometry techniques following (A) LSD1 or (B) HMG20B immunoprecipitation (IP) are shown. Proteins in red exhibit reduced interaction in the presence of OG86. (C) IP westerns of nuclear lysates using the indicated antibodies. (D) IP western shows interaction (white asterisk) of in vitro synthesized HMG20B with purified GST-LSD1, and efficient depletion of HMG20B from flow through. s = short exposure; l = long exposure. (E-G) THP1 AML cells were infected with lentiviral vectors targeting HMG20B for KD, or a non-targeting control (NTC), with puromycin drug resistance as the selectable marker. (E) Western blots show expression of the indicated proteins three days after infection. (F) Mean+SEM colony-forming cell (CFC) frequencies relative to controls after ten days in semi-solid culture (n=3); right panels show representative colonies. (G) Mean+SEM CD11b cell fluorescence relative to control as determined by flow cytometry three and five days after initiation of knockdown (n=2). (H-L) Five independent primary MŁŁ-rearranged AML cells were infected with lentiviral vectors targeting HMG20B for KD (KD1 construct used), or a NTC, with puromycin drug resistance as the selectable marker (# refers to Biobank identifier). (H) Western blots show the indicated proteins three days after infection. (I) Mean+SEM CD11b and CD86 cell fluorescence relative to control five days after initiation of knockdown (n=5 separate patient samples). (J) Mean+SEM CFC frequencies after ten days in semi-solid culture (n=5 separate patient samples). (K) Representative images of colonies. (L) Representative images of cytospin preparations. Mø, macrophage. * indicates P<0.05 by unpaired t-test or, in (F), by one-way ANOVA with a Tukey post hoc test.

