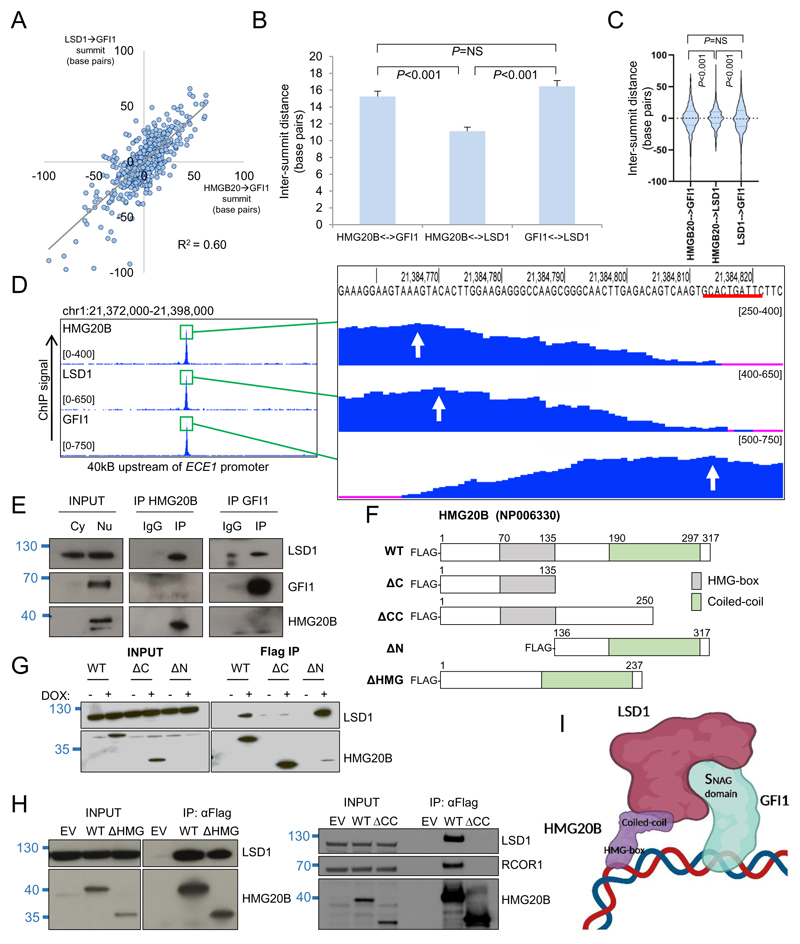
Figure 3. Co-localization pattern of HMG20B, LSD1 and GFI1 on chromatin.
(A) Dot plot show base pair distances between the absolute summits of HMG20B and GFI1 binding peaks (with pileup value ≥300) versus base pair distances between the absolute summits of LSD1 and GFI1 binding peaks. (B) Bar graph shows mean+SEM intersummit base pair distances between the indicated factor binding peaks. (C) Violin plots show distribution, median (thick dotted line) and interquartile range (light dotted lines) for intersummit base pair distances between the indicated factor binding peaks. (D) Exemplar ChIPseq tracks. Red line indicates GFI1 binding motif. White arrows indicate called peak summits. (E) Western shows nuclear immunoprecipitation for the indicated proteins in THP1 AML cells. Cy, cytoplasmic; Nu, nuclear. (F) HMG20B constructs. WT = wild type. (G-H) Westerns shows doxycycline-induced (DOX) expression of HMG20B constructs and αFlag immunoprecipitations in THP1 AML cells. (I) Proposed model of chromatin binding (created with BioRender). For (B) and (C), one way ANOVA with Tukey post hoc test was used to determine statistical significance.

