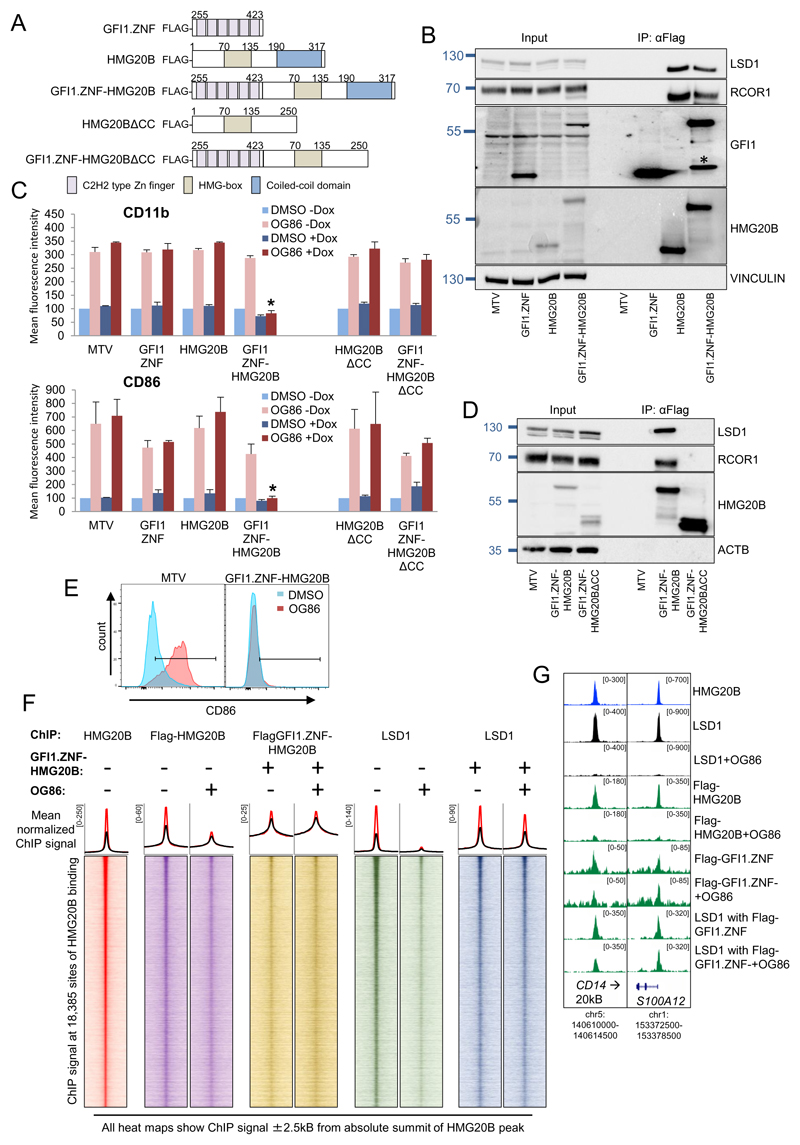
Figure 4. Functional recruitment of LSD1 to chromatin by a GFI1 DNA binding domain:HMG20B fusion protein.
(A) Construct maps. (B) Western shows doxycycline-induced expression of the indicated constructs and αFlag IPs in THP1 AML cells. * indicates degradation product. (C) THP1 AML cells were infected with lentiviruses expressing the indicated doxycycline-inducible (Dox) GFI1 fusion or control constructs and then treated with 250nM OG86 or DMSO vehicle. Bar graphs indicate means+SEM fluorescence intensity for the indicated markers, as determined by flow cytometry, in the indicated conditions 24 hrs later (n=3). * indicates P<0.05 for the indicated condition versus all other OG86+Dox conditions by one way ANOVA and a Tukey post hoc test. (D) Western blot shows Dox-induced expression of the indicated constructs and αFlag IPs in THP1 AML cells. (E) Representative flow cytometry plots. (F) Heatmaps show ChIP signal for the indicated proteins and conditions. Line graphs above show mean normalized ChIP signal for each heatmap surrounding all (black line) or the strongest 20% (red line) of HMG20B peaks. (G) Exemplar ChIPseq peaks tracks.

