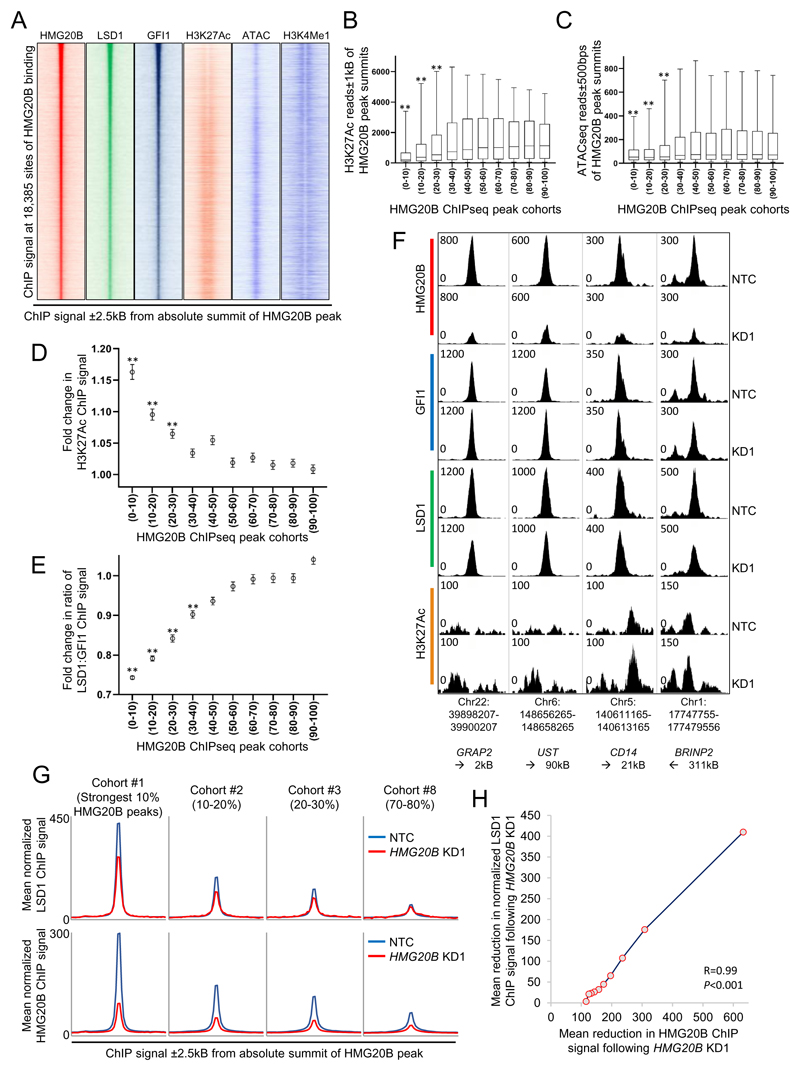
Figure 5. HGM20B stabilizes the interaction of LSD1 with GFI1 on chromatin.
(A) Heatmaps show ChIP signal for the indicated proteins, histone modifications and chromatin accessibility. (B-C) HMG20B ChIPseq peaks were grouped into ten cohorts according to peak strength. Boxplots show median, 25th and 75th centile values (box), and 5th and 95th centile values (whiskers) for (B) H3K27Ac ChIP signal or (C) ATACseq signal surrounding the indicated cohort of HMG20B binding peaks. (D-F) THP1 AML cells were infected with lentiviral vectors targeting HMG20B for KD, or a non-targeting control (NTC). 72 hrs later ChIPseq was performed on puromycin resistant cells. HMG20B ChIPseq peaks were grouped into ten cohorts according to peak strength. Graphs show mean±SEM fold change in (D) H3K27ac ChIP signal or (E) normalized ratio of GFI1:LSD1 ChIP signal surrounding the indicated cohort of HMG20B binding peaks. For (B-E) ** indicates P<0.01 for comparison of each of the top three cohorts versus each of the bottom five cohorts by one way ANOVA and a Tukey post hoc test. (F) Exemplar ChIPseq tracks showing normalized ChIP signal. (G) Density plots show ChIP signal for (upper row) LSD1 (normalized to assume equal GFI1 ChIP signal in NTC and KD conditions) and (lower row) HMG20B in the indicated conditions and for the indicated exemplar cohorts. (H) Graph shows mean absolute loss of LSD1 ChIP signal versus mean loss of HMG20B ChIP signal (±300bps from HMG20B peak summit) for the ten HMG20B cohorts after HMG20B KD.

