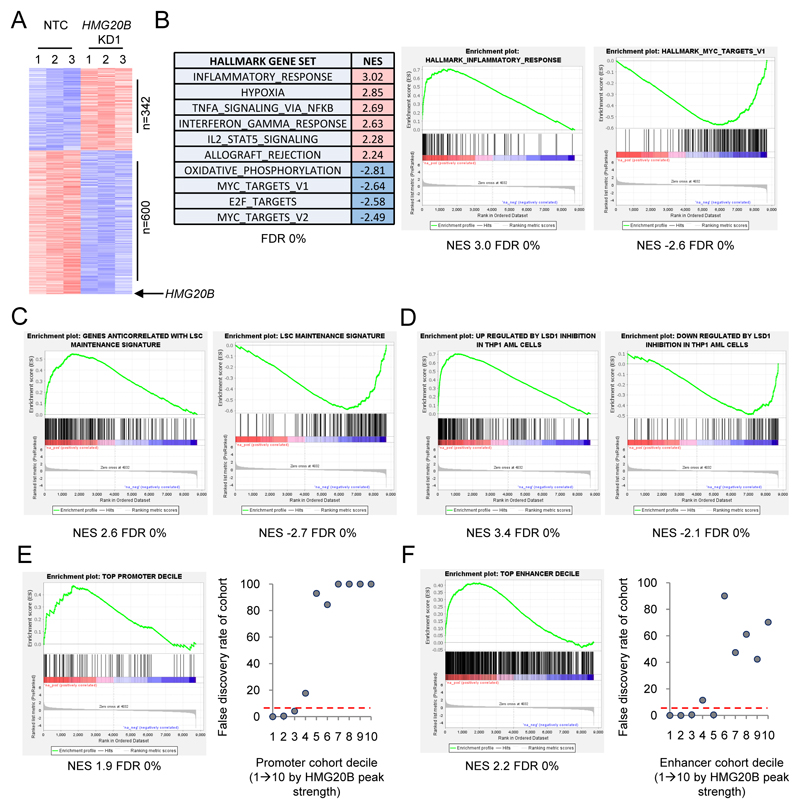
Figure 6. Gene expression changes induced by HMG20B knockdown.
(A-F) THP1 AML cells were infected with lentiviral vectors targeting HMG20B for KD, or a non-targeting control (NTC) and selected for puromycin resistance. (A) Heatmap shows differentially expressed genes 72 hrs after initiation of KD. (B) Summary table and representative GSEA plots. (C-D) GSEA plots. (E-F) HMG20B binding peaks were grouped into ten cohorts according to peak strength and mapped to nearby genes to generate gene sets for use in GSEA. Graphs (right panels) show false discovery rates by cohort for genes bound by HMG20B at (E) promoters and (F) putative enhancers. GSEA plots are shown for the top cohorts (left panels).

