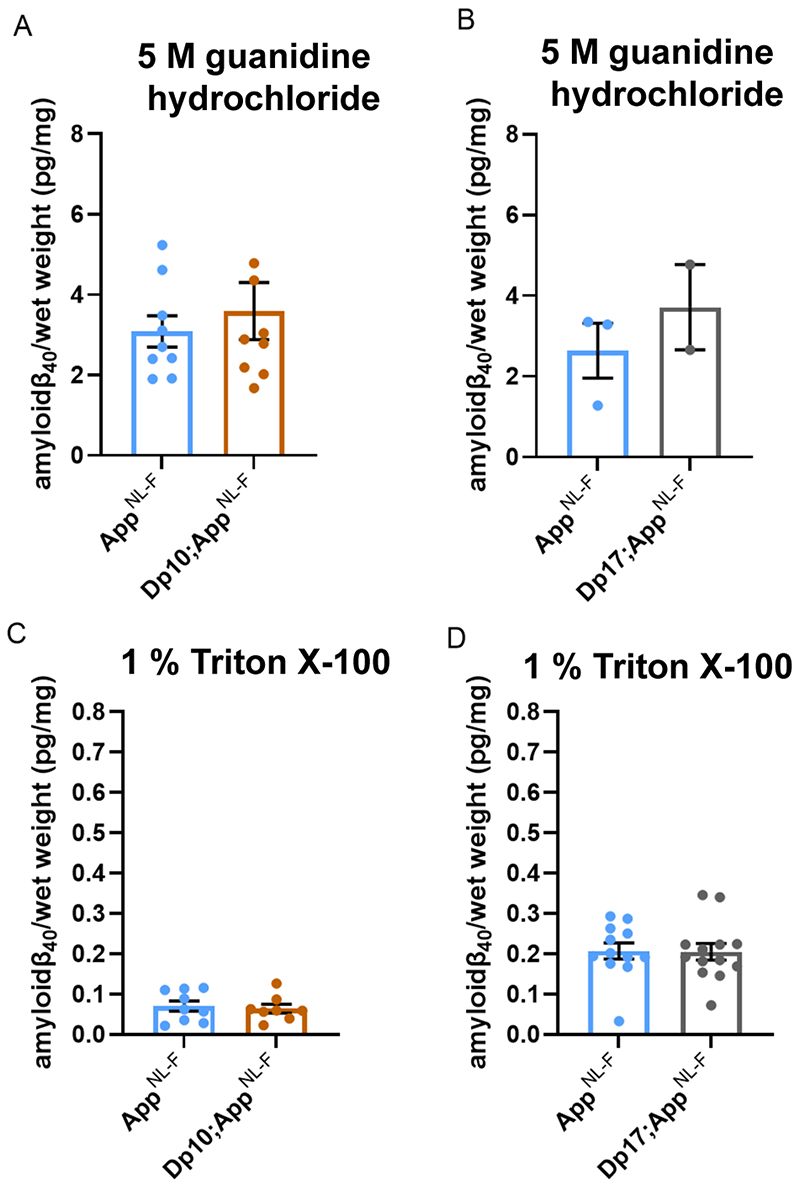
Figure 6. Biochemical solubility of amyloid-β40 is not altered by an additional copy of the Dp(10)2Yey or Dp(17)3Yey Hsa21 orthologous regions.
Total cortical proteins were biochemically fractionated from 8-month of age mice and amyloid-β abundance analysed by MSD assay (6E10). (A) No difference in the abundance of 5 M guanidine hydrochloride-soluble amyloid-β40 was observed between Dp(10)2Yey;AppNL-F/NL-F compared with AppNL-F/NL-F controls (F(1,12) = 2.137, p = 0.169). AppNL-F/NL-F female n = 6, male n = 3; Dp(10)2Yey;AppNL-F/NL-F female n = 4, male n = 5. (B) No difference in the abundance of 5 M guanidine hydrochloride-soluble amyloid-β40 was observed between Dp(17)3Yey;AppNL-F/NL-F compared with AppNL-F/NL-F controls (F(1,1) = 0.782, p = 0.539). AppNL-F/NL-F female n = 1, male n = 2, n = 9 below limit of detection; Dp(17)3Yey;AppNL-F/NL-F female n = 2, male n = 0, n = 12 below limit of detection. (C) No difference in the abundance of 1% Triton X-100-soluble amyloid-β40 was observed between Dp(10)2Yey;AppNL-F/NL-F compared with AppNL-F/NL-F controls (F(1,11) = 0.540, p = 0.478). AppNL-F/NL-F female n = 6, male n = 3; Dp(10)2Yey;AppNL-F/NL-F female n = 4, male n = 4. (D) No difference in the abundance of 1% Triton X-100-soluble amyloid-β40 was observed between Dp(17)3Yey;AppNL-F/NL-F compared with AppNL-F/NL-F controls (F(1,19) = 0.007, p = 0.982). AppNL-F/NL-F female n = 7, male n = 5; Dp(17)3Yey;AppNL-F/NL-F female n = 7, male n = 6, n = 1 below limit of detection. Details of negative controls, which do not carry an AppNL-F allele in Table 2. Error bars show SEM, data points are independent mice. Dp(10)2Yey abbreviated to Dp10 and Dp(17)3Yey abbreviated to Dp17 for clarity.

