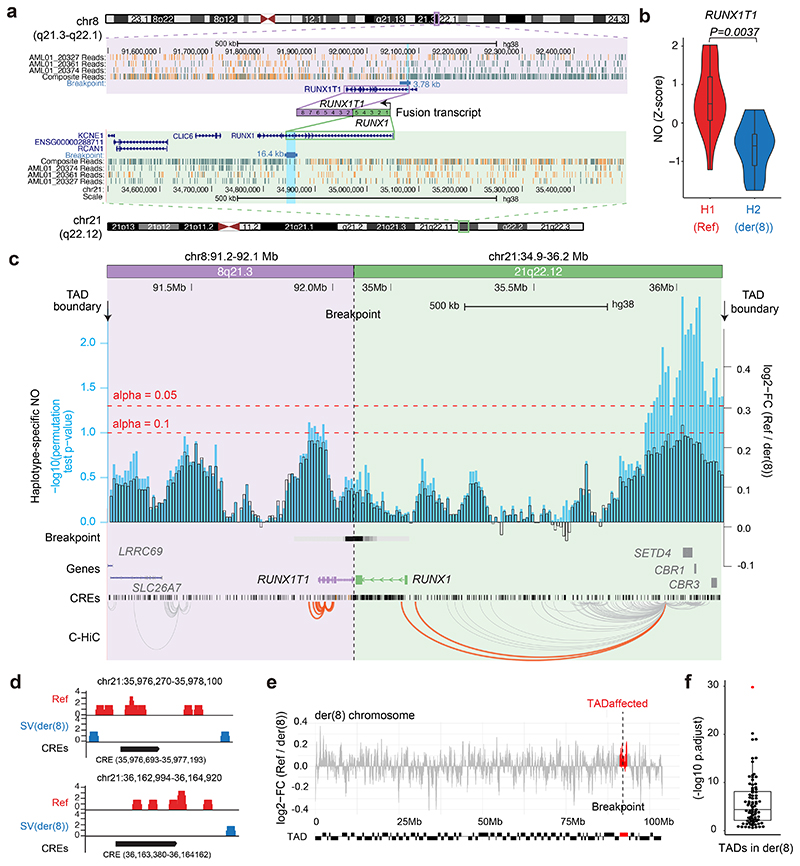
Figure 3. Haplotype-specific NO analysis shows local effects of a copy-neutral driver SV in AML.
(a) Balanced t(8;21) translocation in AML_1, discovered based on strand co-segregation (P-value for translocation discovery using strand co-segregation24: P=0.00003, FDR-adjusted Fisher’s exact test, Fig. S16). The SV breakpoint was fine-mapped to the region highlighted in light blue. Composite reads shown were taken from all informative cells in which reads could be phased (WC or CW configuration; Methods). (b) A violin plot demonstrates haplotype-specific NO at the RUNX1T1 gene body (10% FDR; two-sided wilcoxon ranksum test followed by Benjamini Hochberg multiple correction; n = 17 single-cells; boxplot was defined by minima = 25th percentile - 1.5X interquartile range (IQR), maxima = 75th percentile + 1.5X IQR, center = median, and bounds of box = 25th and 75th percentile), consistent with aberrant activity of the locus on der(8). (c) Haplotype-specific NO around the SV breakpoint. Fold changes of haplotype-specific NO, measured between the RUNX1-RUNX1T1 containing derivative chromosome (der(8)) and corresponding regions on the unaffected homologue (Ref), are shown in black, and -log10(P-values) in light blue. Enhancer-target gene physical interactions based on chromatin conformation capture56–93 are depicted in orange (interactions involving RUNX1 and RUNX1T1) and grey (involving other loci). (d) Significant CREs located within the distal peak region, demonstrating haplotype-specific absence of NO on der(8) at 10% FDR, suggesting increased CRE accessibility on der(8). Within the segment ~0.8 to 1.1Mb upstream of RUNX1, which showed pronounced haplotypespecific NO, we tested 69 CREs for haplotype-specific NO, which identified two significant CREs. (e) Haplotype-specific NO measured between der(8) and corresponding regions of the unaffected homologue. Red: regions corresponding to the fused TAD. (f) A beeswarm plot shows that the fused TAD (red) is an outlier in terms of haplotype-specific NO on der(8) (P-values based on KS tests; n = 83 TADs in der(8); boxplot was defined by minima = 25th percentile - 1.5X interquartile range (IQR), maxima = 75th percentile + 1.5X IQR, center = median, and bounds of box = 25th and 75th percentile).

