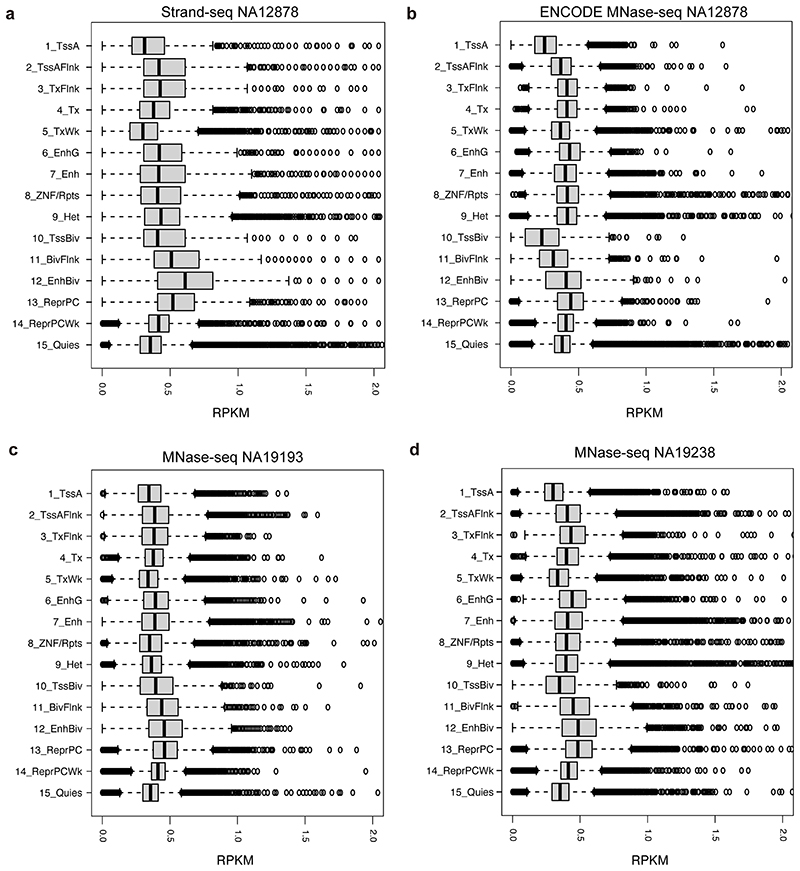
Extended Data Fig. 2. Read depth of Strand-seq and MNase-seq data stratified into 15 chromatin states defined by Roadmap epigenome consortium33.
15 chromatin states based on the NA12878 cell line were utilized in this genome-wide analysis. Plots generated represent Strand-seq data from NA12878 (n = 95 cells) (a), and publicly available MNase-seq from NA12878, NA19193, and NA19238 (n = 1 sample each) (b-d). The bulk MNase-seq experiment of NA12878 was pursued using single-end SOLID sequencing reads, and that of NA19193 and NA19238 was done using paired-end Illumina reads. The X-axis in the box plot indicates reads per kilobase per million (RPKM) measured for each genomic segment annotated by one of the 15 chromatin states. Abbreviations for chromatin states33 are: TssA-Active TSS, TssAFlnk-Flanking Active TSS, TxFlnk - Transcription at gene 5’and 3’, Tx - Strong transcription, TxWk - Weak transcription, EnhG - Genic enhancers, Enh - Enhancers, ZNV/Rpts - ZNF genes & repeats, Het - Heterochromatin, TssBiv - Bivalent/Poised TSS, BivFlnk - Flanking Bivalent TSS/Enh, EnhBiv - Bivalent Enhancer, ReprPC - Repressed PolyComb, ReprPCWk - Weak Repressed PolyComb, Quies - Quiescent/Low. Boxplots were defined by minima = 25th percentile - 1.5X interquartile range (IQR), maxima = 75th percentile + 1.5X IQR, center = median, and bounds of box = 25th and 75th percentile. Both Strand-seq and MNase-seq assays measured NO in all fifteen chromatin states. Among these chromatin states, Strand-seq and MNase-seq revealed the highest NO signals on average for the polycomb repressed state and the bivalent enhancer state; whereas the lowest average NO signals were consistently seen for the active transcription start site (TSS) state.

