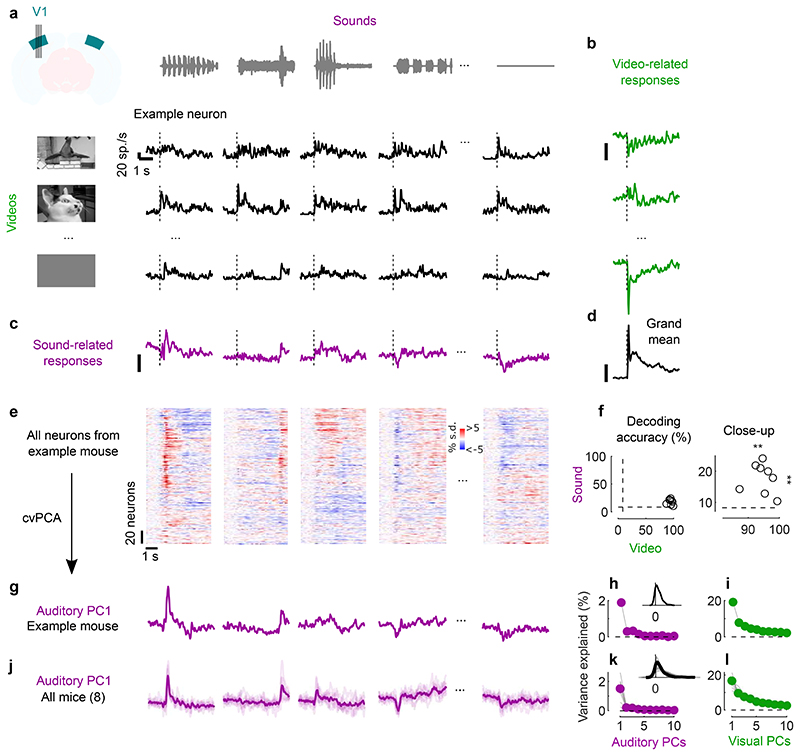
Fig. 1. Sounds evoke stereotyped responses in visual cortex.
a. Responses of an example neuron to combinations of sounds (columns) and videos (rows). Responses were averaged over 4 repeats. b. Video–related time courses (averaged over all sound conditions, minus the grand average) for the example neuron in a. c. Same, for the sound-related time courses. d. Grand average over all conditions for the neuron. Scale bars in b-d: 20 spikes/s. e. Sound-related time courses for all 212 neurons in one experiment, sorted using rastermap13. f. Decoding accuracy for video vs. sound (**: p = 0.0039, right-tailed Wilcoxon sign rank test, n = 8 mice). Dashed lines show chance level (1/12). g. Time courses of the first principal component of the sound-related responses in e (‘auditory PC1’, arbitrary units). h. Fraction of total variance explained by auditory PCs, for this example mouse; inset: distribution of the weights of auditory PC1 (arbitrary units), showing that weights were typically positive. i. Same, for visual PCs. j-l Same as g-i, for individual mice (thin curves) and averaged across mice (thick curves).

