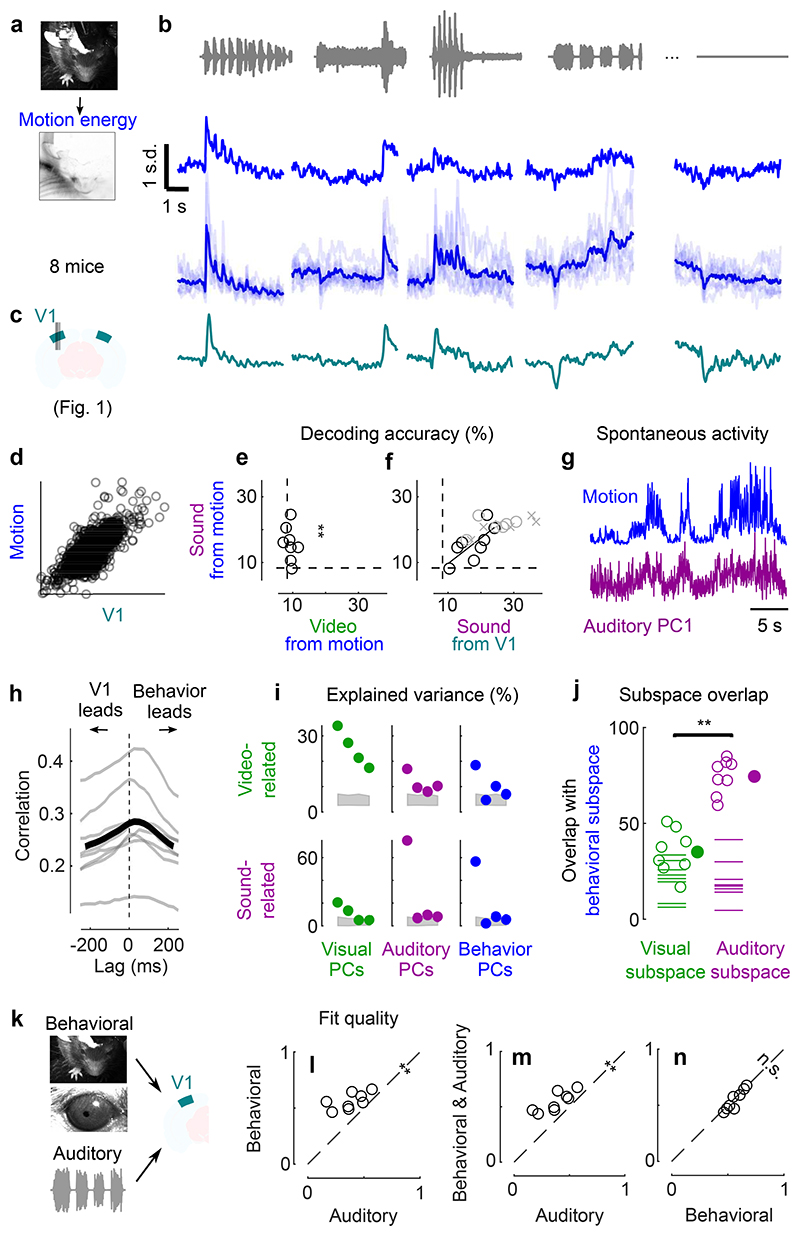
Fig. 4. Sounds evoke stereotyped, uninstructed behaviors that predict sound responses in visual cortex.
a. Extraction of motion PCs from videos of the mouse face. b. Sounds evoked changes in the first motion PC, both in an example mouse (top) and all mice (bottom). Scale bar: 1 s.d. c. Time courses of the auditory PC1 in visual cortex (from Fig. 1). d. Comparison of the time courses of motion (taken from b) and of the auditory PC1 from V1 (taken from Fig. 1); all arbitrary units. e. Decoding of sound identity from the first 128 motion PCs was significantly above chance level (dashed lines) (**: p = 0.0078, right-tailed Wilcoxon sign rank test, n = 8 mice). f. Across mice, there was a strong correlation between the accuracy of sound decoding from facial motion and from V1 activity. The linear regression is performed on the control mice from Fig. 1 (black dots). Data from transectomy mice (gray markers) confirm the trend, both in the cut side (crosses) and on the uncut side (circles). g. Time course of facial motion (top) and of V1 activity along auditory PC1 (bottom) in the absence of any stimulus, for an example mouse. h. Cross-correlogram of these time courses, for individual mice (gray) and their average (black). The positive lag indicates that movement precedes neural activity. i. Video- and sound-related variance explained by neural activity along the visual (left), auditory (middle), or behavioral (right) subspaces (first 4 PCs of each subspace), for one example mouse. The gray regions show 90% confidence intervals expected by chance (random components). j. Overlap between the auditory or the visual subspace and the behavioral subspace for each mouse (open dots) and all mice (filled dot) (**: p = 0.0078, two-sided paired Wilcoxon sign rank test, n = 8 mice). Dashed lines show the significance threshold (95th percentile of the overlap with random dimensions) for each mouse. k. Schematics of the 3 encoding models trained to predict the average sound-related activity in the auditory subspace. l-n. Cross-validated correlation of the actual sound responses and their predictions for all mice, comparing different models (Auditory, Behavioral, and Full; **: p = 0.0078, two-sided paired Wilcoxon sign rank test, n = 8 mice).

