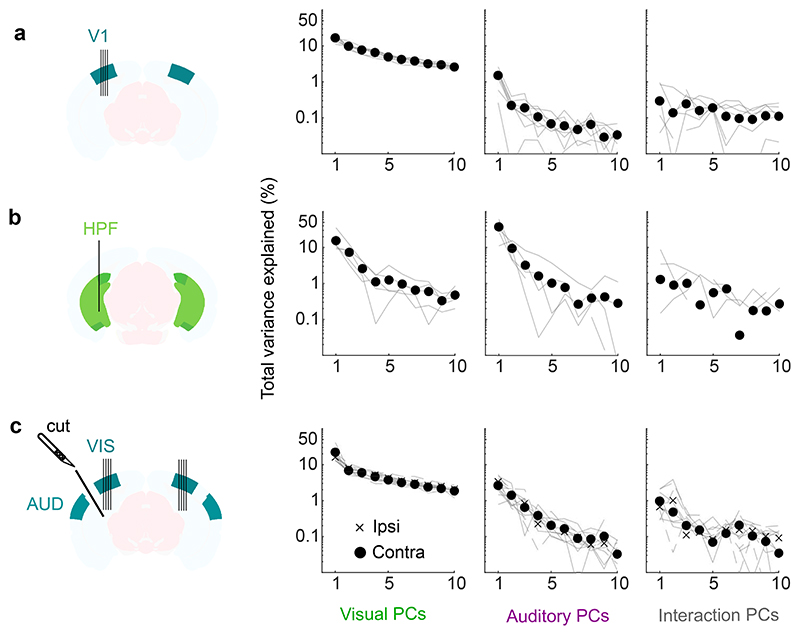
Extended Data Fig. 2. Dimensionality of auditory and visual responses in visual cortex and hippocampal formation.
a. Top: Total variance explained (normalized test-retest covariance) for visual PCs (left), auditory PCs (middle) and interactions PCs (right), for all 8 recordings in V1 (thin lines) and their average (filled dots). The total variance is measured from the normalized test-retest covariance, which can occasionally be negative (not visible in logarithmic scale). b. Same as a but with the 5 recordings from the HPF. c. Same as a but with the 12 recordings from the visual cortices ipsilateral (6, crosses) and contralateral (6, filled dots) to the cut (6 sessions across 3 mice).

