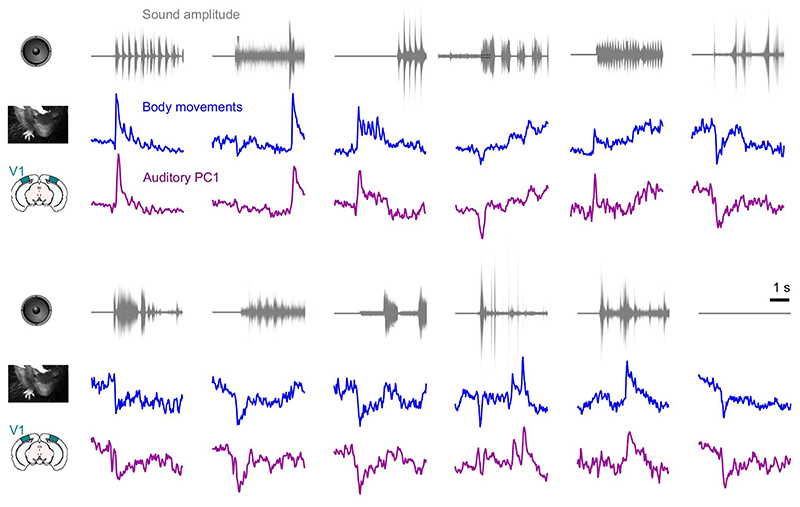
Extended Data Fig. 4. Neural and behavioral responses differ across sounds but resemble each other.
Responses along neural auditory PC1 from V1 (purple), and motion energy (blue) for all sounds. Responses are averaged over trials, videos, and mice, and z-scored. The top trace (gray) shows the envelope of the corresponding sound. As in all main text figures, these responses are expressed relative to the grand average over sounds and videos; this explains the negative deflections seen in the responses to the blank stimulus.

