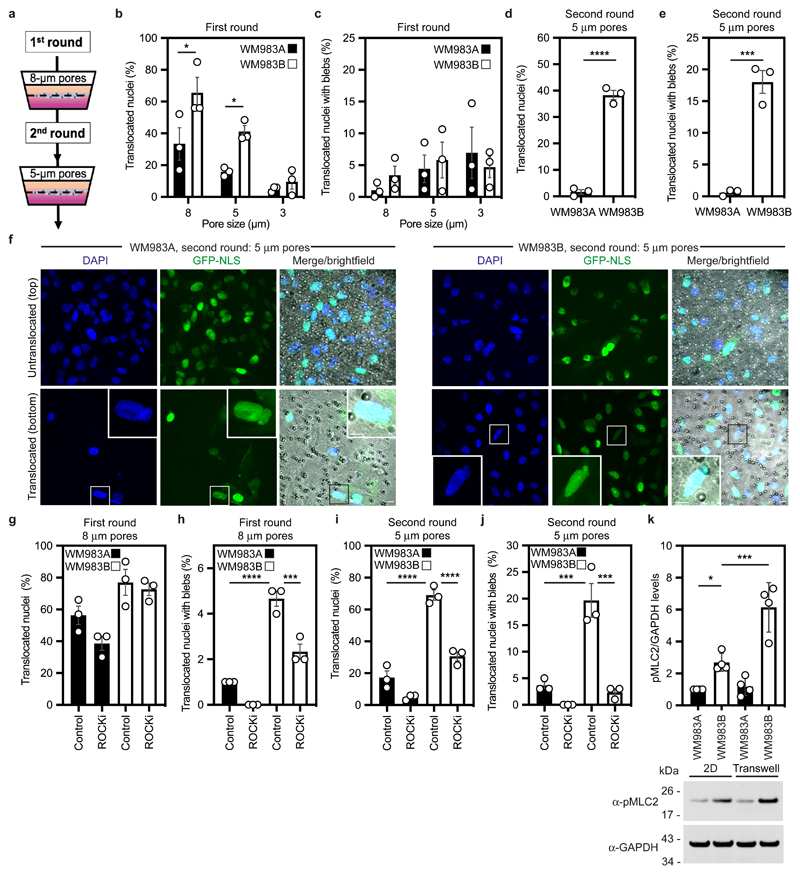
Figure 1. Metastatic melanoma cells can negotiate repeated constraints.
(a) Schematic of transwell assays. Briefly, cells were challenged to migrate through transwells once or collected after a round of migration and challenged again. The arrows indicate the direction for chemotactic migration. (b,c) Percentage of primary melanoma WM983A cells and metastatic melanoma WM983B cells stably expressing GFP-NLS that translocated their nuclei (b) and displayed nuclear envelope blebs (c) after one round of migration in transwells of various pore sizes. n= 1758 and 1728 cells, respectively. (d,e) Percentage of WM983A and WM983B cells stably expressing GFP-NLS that translocated their nuclei (d) and displayed nuclear envelope blebs (e) after a second round of transwell migration through 5-μm pores. n= 192 and 313 cells, respectively. (f) Representative images of WM983A and WM983B cells stably expressing GFP-NLS and stained for DNA after a second round of transwell migration through 5-μm pores. Transwell pores were visualised using transmitted light. Magnifications show nuclei that translocated and displayed nuclear envelope blebs indicated by white arrow heads. Scale bars, 30 μm and 10 μm magnifications. (g,h) Percentage of WM983A and WM983B cells stably expressing GFP-NLS that translocated their nuclei (g) and displayed nuclear envelope blebs (h) after one round of transwell migration through 8-μm pores upon ROCK inhibitor (ROCKi, GSK269962A) treatment. n= 1689 and 1757 cells, respectively. (i,j) Percentage of WM983A and WM983B cells stably expressing GFP-NLS that translocated their nuclei (i) and displayed nuclear envelope blebs (j) after a second round of transwell migration through 5-μm pores upon ROCKi treatment. n= 1119 and 1487 cells, respectively. (k) Resolved lysates from WM983A and WM983B cells grown in 2D or collected after overnight passage through 8 μm Transwell pores were examined by western blotting with anti-pMLC and anti-GAPDH antisera, and quantified by densitometry (above). Bar charts show the mean and error bars represent S.E.M. from N = 3 individual experiments. In k, error bars represent the S.D. from N = 4 independent experiments. P-values calculated by one-way ANOVA (g-k), two-way ANOVA (b,c), and two-tailed unpaired t-test (d,e); *p<0.05, ***p<0.001, ****p<0.0001. Numerical data and exact p-values are available in the Source Data.

