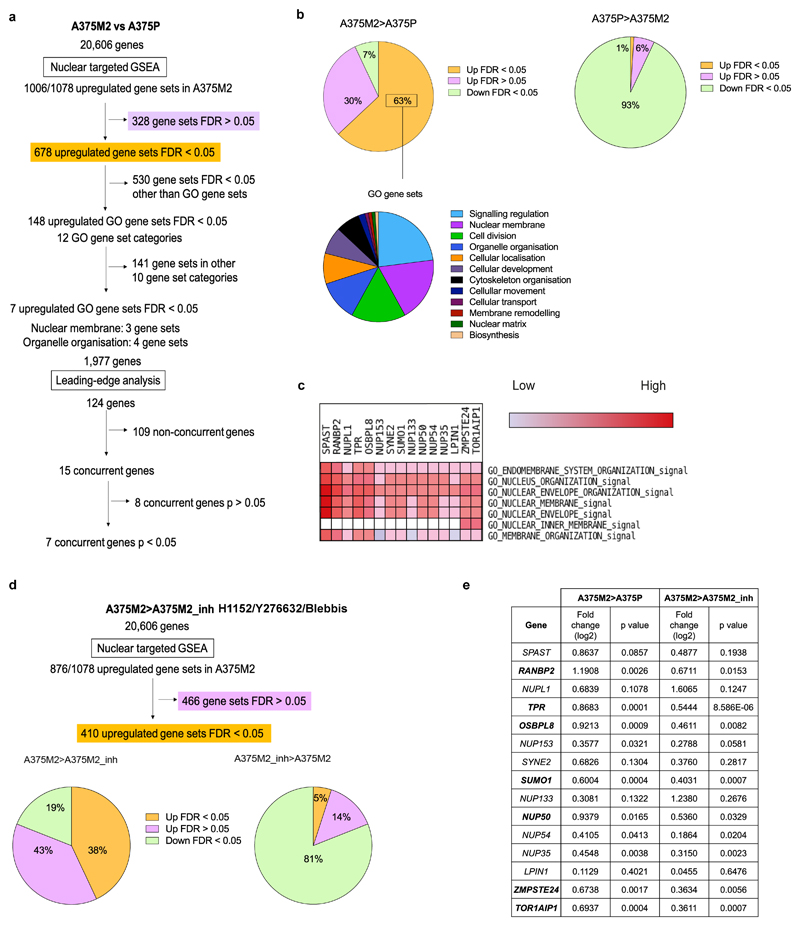
Extended Data Figure 5. Transcriptomics reveals TOR1AIP1 upregulation in metastatic melanoma cells.
(a) Flow diagram of GSEA carried out comparing highly amoeboid and highly metastatic melanoma A375M2 cells with less amoeboid and less metastatic melanoma A375P cells from data of gene expression microarray analysis. (b) The upper pie charts show the distribution of upregulated and downregulated nuclear gene sets in A375M2 cells (left) and A375P cells (right). The lower pie chart shows the 12 most enriched GO gene set categories in A375M2. (c) Section of heatmap of the leading-edge analysis showing a cluster of upregulated nuclear envelope genes in A375M2 cells. (d) Flow diagram of the GSEA carried out comparing A375M2 cells with A375M2 cells treated with contractility inhibitors (ROCK inhibitors H1152 or Y27632 or myosin inhibitor blebbistatin) (A375M2_inh). The graphs show the distribution of upregulated and downregulated nuclear gene sets in A375M2 cells (left) and A375M2_inh (right). (e) Upregulated nuclear envelope genes selected from leading-edge analysis with their log2 fold change in expression and statistical significance in A375M2 compared to A375P cells and in A375M2 compared to A375M2_inh. Statistically significant upregulated genes appear in bold in the table. P-values calculated by two-tailed unpaired t-test.

