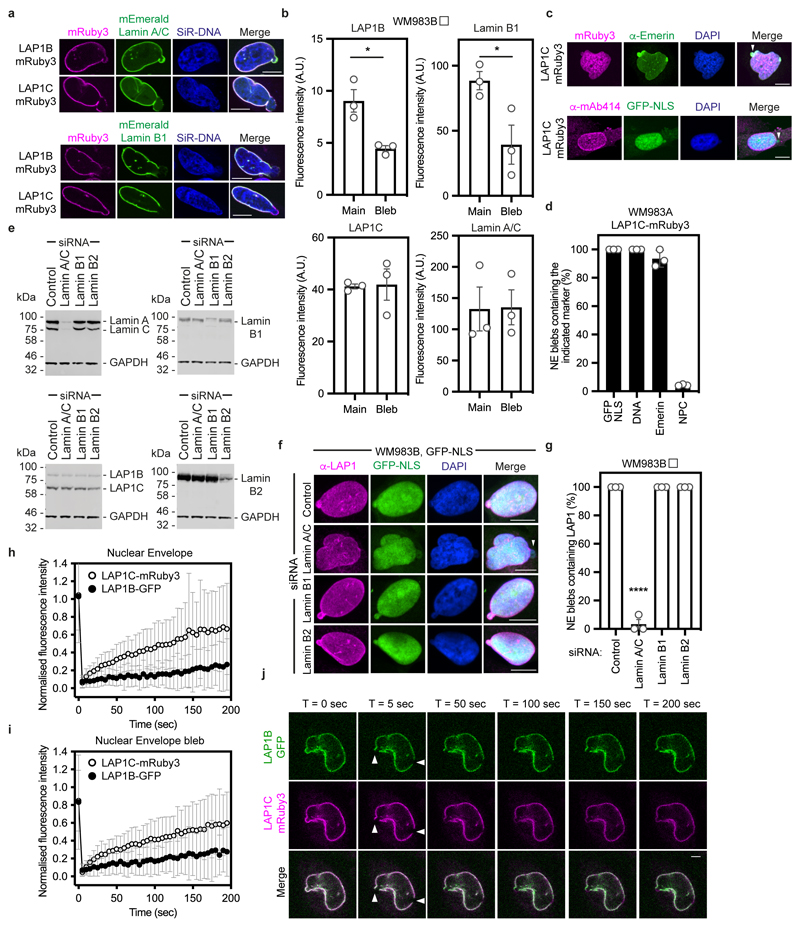
Extended Data Figure 8. Lamin-binding properties of LAP1 isoforms.
(a) WM983B cells stably expressing LAP1B-mRuby3 or LAP1C-mRuby3, transfected with mEmerald-lamin A/C or mEmerald-lamin B1, stained with SiR-DNA and displaying nuclear envelope blebs. Scale bars, 10 μm. (b) Levels of LAP1B-mRuby3, LAP1C-mRuby3, mEmerald-Lamin A/C and mEmerald-Lamin B1 in the main nucleus and in NE blebs of WM983B cells stably expressing the indicated LAP1-mRuby proteins. n= 43, 63, 30 and 42, respectively. (c) WM983A cells stably expressing LAP1C-mRuby3 and stained for Emerin and DNA (top) or NPCs (bottom). NE blebs indicated by arrowhead. Scale bars, 10 μm (d) Quantification of data from (c). n= 671 and 605 for anti-Emerin and anti-NPC staining, respectively. (e) Representative immunoblots for lamin A/C, LAP1, lamin B1 and lamin B2 expression levels in WM983B cells after 72 hours of siRNA depletion of lamin A/C, lamin B1 or lamin B2 with siGENOME SMARTpools. (f) Representative pictures of WM983B stably expressing GFP-NLS (green) and stained for endogenous LAP1 (magenta) and DNA (blue) and transfected with the indicated siRNA. NE blebs without LAP1 staining indicated by arrowhead. Scale bars, 10 μm. (g) Percentage of nuclear envelope blebs containing LAP1 upon depletion of lamin A/C, lamin B1 or lamin B2 with siGENOME SMARTpools in WM983B cells. (h-j) FRAP analysis of LAP1 isoforms at the main nuclear envelope (h) and at nuclear envelope blebs (i) in metastatic melanoma WM983B cells stably co-expressing LAP1B-GFP and LAP1C-mRuby3. n= 26 cells. (j) Representative images from h and i. Scale bars, 5 μm. White arrowheads indicate bleaching at the main nuclear envelope and at the nuclear envelope bleb. In b,d,g, graphs show the mean and error bars represent S.E.M. from N = 3 independent experiments. In i,j graphs show the mean and error bars represent S.D. P-values calculated by one-way ANOVA (g); *p<0.05, ****p<0.0001. Numerical data and exact p-values are available in the Source Data.

