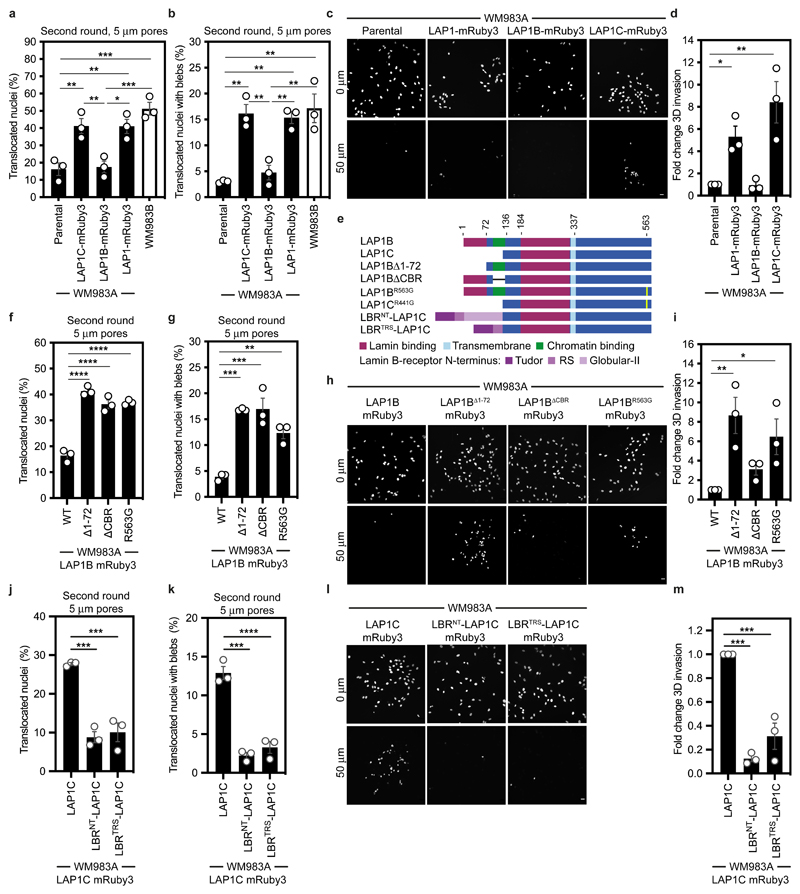
Figure 5. LAP1C supports constrained migration and invasion.
(a,b) Percentage of primary melanoma WM983A cells stably expressing GFP-NLS alone or WM983A cells stably expressing GFP-NLS and LAP1C-mRuby3, LAP1B-mRuby3 or LAP1-mRuby3 and metastatic melanoma WM983B cells stably expressing GFP-NLS that translocated their nuclei (a) and displayed nuclear envelope blebs (b) after a second round of transwell migration through 5-μm pores. n= 668, 694, 592, 722, 633 cells, respectively. (c,d) Representative images (c) of WM983A GFP-NLS, WM983A GFP-NLS LAP1-mRuby3, WM983A GFP-NLS LAP1B-mRuby3 or WM983A GFP-NLS LAP1C-mRuby3 cells invading into collagen I matrices and stained for DNA at Z=0 μm and Z=50 μm and (d) 3D invasion index from (c). Scale bars, 30 μm. n= 545, 609, 462, and 619 cells, respectively. (e) Schematic of LAP1B lacking the arginine finger (LAP1BR563G), LAP1B lacking lamin-binding region 1-72 (LAP1BΔ1-72), LAP1B lacking its chromatin-binding region (LAP1BΔCBR) and LAP1C and LBR-fusions to LAP1C’s N-terminus. (f,g) Percentage of WM983A cells stably expressing GFP-NLS and LAP1B-mRuby3, LAP1BΔ1-72-mRuby3, LAP1BΔCBR-mRuby3 or LAP1BR563G-mRuby3 that translocated their nuclei (f) and displayed nuclear envelope blebs (g) after a second round of transwell migration through 5-μm pores. n= 518, 678, 545, 704 cells, respectively. (h,i) Representative images (h) of WM983A GFP-NLS LAP1B-mRuby3, WM983A GFP-NLS LAP1BΔ1-72-mRuby3, WM983A GFP-NLS LAP1BΔCBR-mRuby3 and WM983A GFP-NLS LAP1BR563G-mRuby3 cells invading into collagen I matrices and stained for DNA at Z=0 μm and Z=50 μm into collagen and (i) 3D invasion index for (h). Scale bars, 30 μm. n= 462. (j,k) Percentage of primary melanoma WM983A cells stably expressing GFP-NLS and LAP1C-mRuby3, LBRNT-LAP1C-mRuby3 or LBRTRS-LAP1C-mRuby3 that translocated their nuclei (j) and displayed nuclear envelope blebs (k) after a second round of transwell migration through 5-μm pores. n= 418, 402 and 385, respectively. (l,m) Representative images of WM983A GFP-NLS LAP1C-mRuby3, WM983A GFP-NLS LBRNT-LAP1C-mRuby3 and WM983A GFP-NLS LBRTRS-LAP1C-mRuby3 cells invading into collagen I matrices and stained for DNA at Z=0 μm and Z=50 μm into collagen and (m) 3D invasion index for (l), n= 918, 780 and 736, respectively. Scale bars, 30 μm. Bar charts show the mean and error bars represent S.E.M. from N = 3 independent experiements. P-values calculated by one-way ANOVA; *p<0.05, **p<0.01, ***p<0.001, ****p<0.0001. Numerical data and exact p-values are available in the Source Data.

