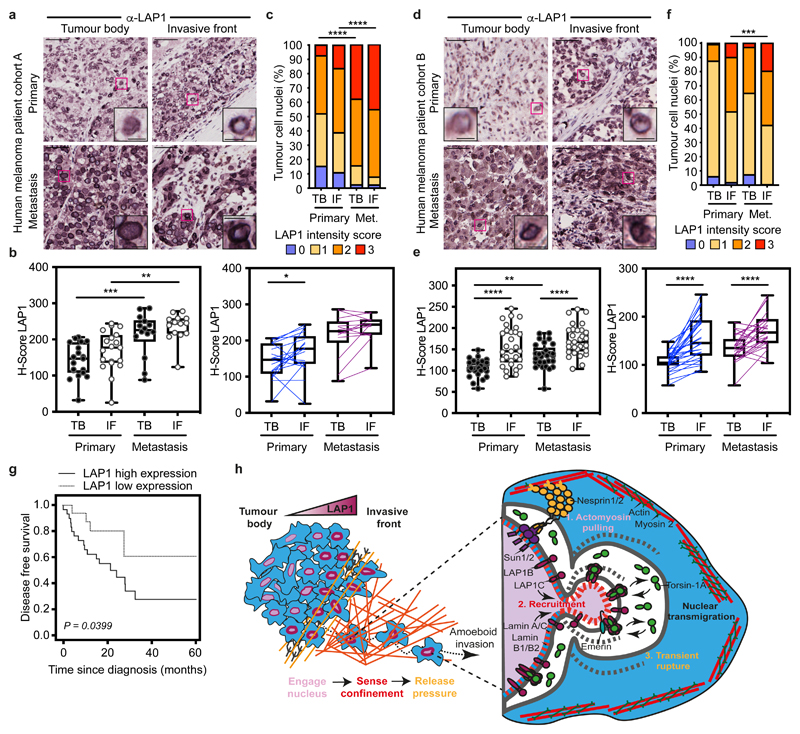
Figure 7. LAP1 levels increase in human melanoma progression.
(a) Representative images of tumour body (TB) and invasive front (IF) of a primary tumour and a metastasis in human melanoma patient cohort A. Scale bars, 50 μm. The magnifications show representative cell nuclei. Scale bars, 10 μm. (b) H-score for LAP1 staining in TB and IF of primary tumours and metastases in cohort A by unpaired (left) or paired (right) analysis. (c) Percentage of tumour cell nuclei according to LAP1 intensity score in TB and IF of primary tumours and metastases in patient cohort A. Significant p values shown are for LAP1 score 3. n= 19 primary tumours and 14 metastases. (d) Representative images of TB and IF of a primary tumour and a metastasis in human melanoma patient cohort B. Scale bars, 50 μm. The magnifications show representative cell nuclei. Scale bars, 10 μm. (e) H-score for LAP1 staining in TB and IF of primary tumours and metastases in patient cohort B by unpaired (left) or paired (right) analysis. (f) Percentage of tumour cell nuclei according to LAP1 intensity score in TB and IF of primary tumours and metastases in patient cohort B. Significant p values shown are for LAP1 score 3. n= 29 primary tumours and 29 metastases. (g) Kaplan–Meier survival curve of disease-free survival according to LAP1 expression in the IF from primary melanomas. LAP1 expression was categorized as low or high using the mean expression. n= 46 primary melanomas. (h) Summary model. LAP1 levels are elevated at the invasive front of melanoma tumours, which are enriched in cells displaying amoeboid features like a rounded cell morphology, high levels of Myosin II and nuclear envelope blebs. LAP1C, but not LAP1B, can localise to nuclear envelope blebs in a Lamin A/C dependent manner and promotes transit through physical constraints through its weaker N-terminal NE/lamina tethering allowing NE blebbing. In b,e Horizontal lines show the median and whiskers show minimum and maximum range of values. p values calculated by one-way ANOVA (b,e), two-way ANOVA (c,f), two-tailed unpaired and paired t-test (b,e) and (g) log-rank test; *p<0.05, **p<0.01, ***p<0.001, ****p<0.0001. Numerical data and exact p-values are available in the Source Data.

