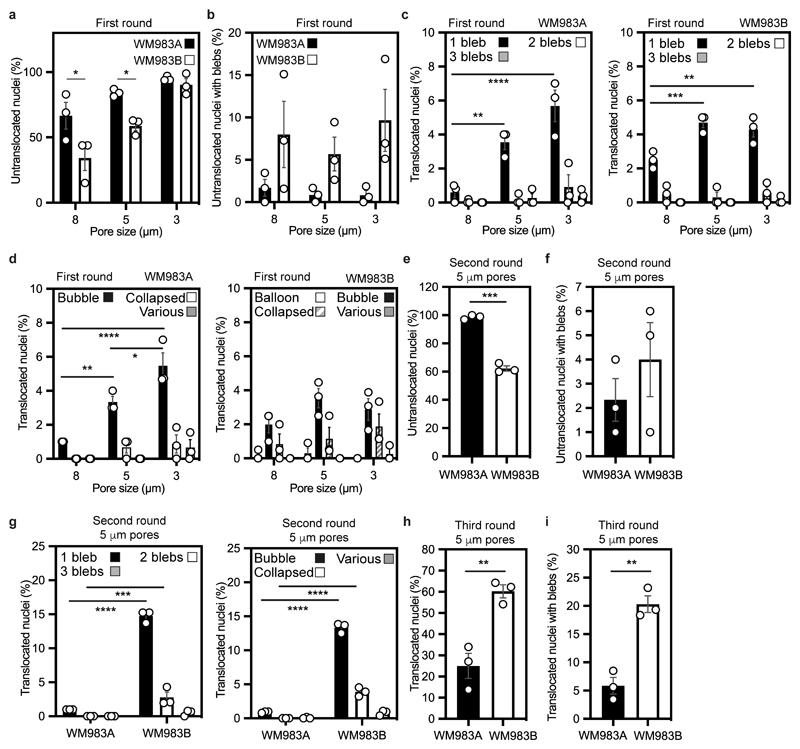
Extended Data Figure 1. Multi-round transwell migration assays with melanoma cells.
(a,b) Percentage of primary melanoma WM983A and metastatic melanoma WM983B cells that did not translocate their nuclei (a) and displayed nuclear envelope blebs (b) after one round of migration in transwells of various pore sizes. (c,d) Percentage of WM983A and WM983B cells that translocated their nuclei and displayed nuclear envelope blebs classified according to bleb number (c) and bleb shape (d) after one round of migration in transwells of various pore sizes. n= 1758 and 1728 cells, respectively. (e,f) Percentage of WM983A and WM983B cells that did not translocate their nuclei (e) and displayed nuclear envelope blebs (f) after a second round of transwell migration through 5-μm pores. (g) Percentage of WM983A and WM983B cells that translocated their nuclei and displayed nuclear envelope blebs classified according to bleb number (left) and bleb shape (right) after a second round of transwell migration through 5-μm pores. n= 192 and 313 cells, respectively. (h,i) Percentage of WM983A and WM983B cells that translocated their nuclei (h) and displayed nuclear envelope blebs (i) after a third round of transwell migration through 5-μm pores. n= 536 and 606 cells, respectively. Bar charts show the mean and error bars represent S.E.M. from N = 3 independent experiments. P-values calculated by two-way ANOVA (a,b,c,d,g), and unpaired two-tailed t-test (e,f,h,i); *p<0.05, **p<0.01, ***p<0.001, ****p<0.0001. Numerical data and exact p-values are available in the Source Data.

