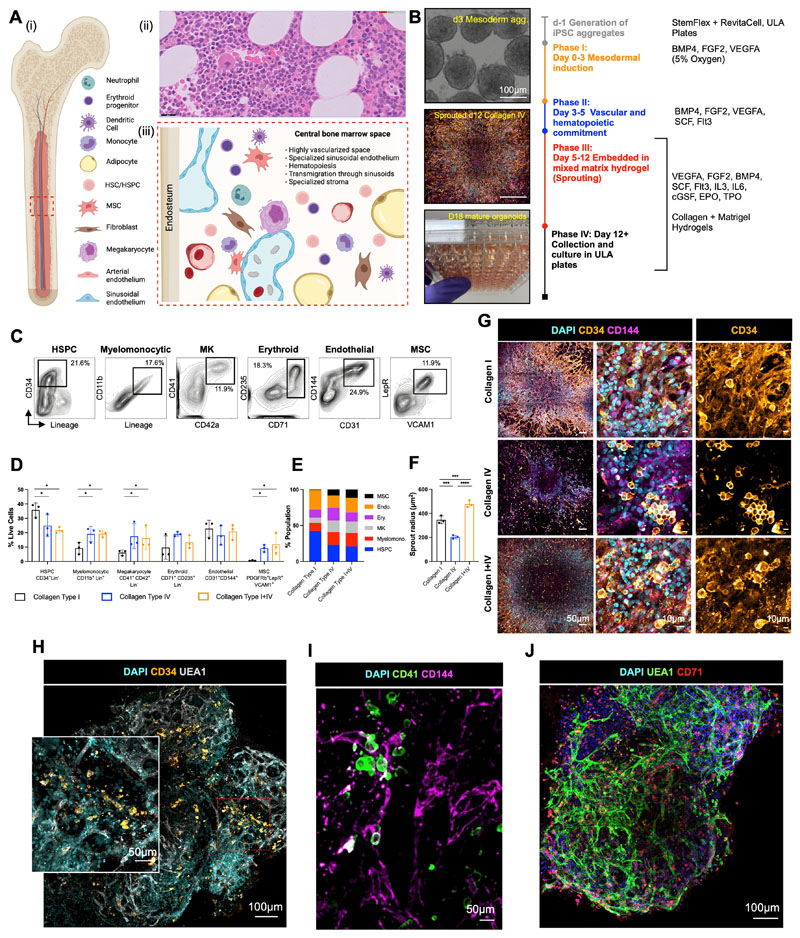
Figure 1. Mixed-matrix hydrogels containing Matrigel and type I and IV collagens are optimal for production of vascularised, myelopoietic organoids.
(A) (i) Central bone marrow is a complex tissue including mesenchymal stromal cell (MSC), endothelial, hematopoietic stem and progenitor cells (HSC/HSPCs), myeloid and lymphoid subsets. (ii) Hematoxylin and Eosin stained section and (iii) model of human bone marrow highlighting the diverse hematopoietic and stromal cell types (created using Biorender.com). (B) Differentiation workflow, in which iPSC aggregates undergo mesodermal induction (day 0-3) and commitment to hematopoietic and vascular lineages (day 3 – 5). Cell aggregates are then embedded in mixed matrix hydrogels comprised of Matrigel and collagen I, collagen IV, or collagen I+IV mix at a 40:60 ratio to support vascular sprouting. Key media components are listed for each phase. (C) Gating strategy and (D) quantification of stromal and hematopoietic cell types in day 18 organoids supported by Matrigel + collagen type I only, collagen IV only and collagen I+IV hydrogels. (E) Distribution of lineages as fractions of the whole organoid population. (F) Radius of endothelial sprouts and (G) sprouting day 12 organoids immunostained for nuclei (DAPI), CD34 and CD144 (VE-cadherin). (H, I, J) Whole organoid Z-stack imaging acquired at day 18 showing (H) CD34+ HSPCs and UEA1+ vessels that are negative for CD34; (I) CD41+ megakaryocytes and (J) CD71+ erythroid cells dispersed throughout the organoids and associating with CD144+/UEA1+ vasculature. * p < 0.05, ** p < 0.01, *** p < 0.001, One-Way ANOVA with multiple comparisons (Fisher’s LSD) n = 3 for endothelial sprout radius measurements. Two-Way ANOVA with multiple comparisons (Fisher’s LSD); n = 3 (3 independent differentiations, 15 pooled organoids each) for flow cytometry analysis. Representative images shown. See also Figure S1.

