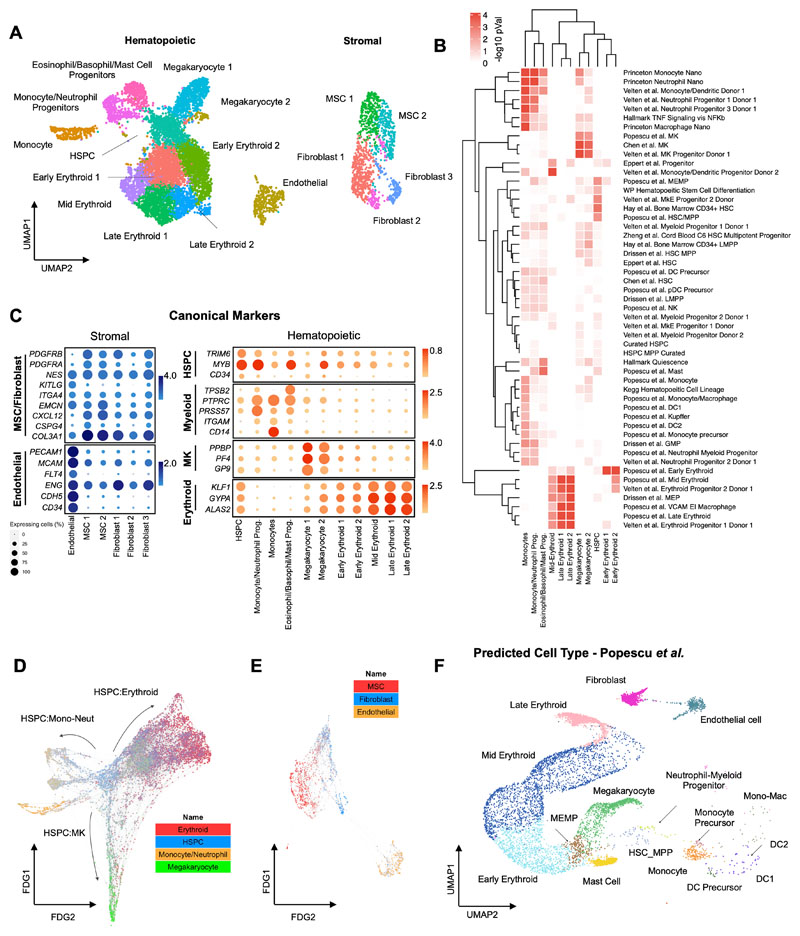
Figure 3. scRNAseq confirmed that hematopoietic and stromal cell lineages within organoids showed transcriptional similarity to human hematopoietic tissues.
(A) Uniform Manifold Approximation and Projection (UMAP) plot showing annotated cell clusters. (B) Gene Set Enrichment Analysis (GSEA) of differentially expressed genes for each cluster using a curated set of 64 hematopoietic lineage gene sets. (C) Expression of canonical stromal and hematopoietic cell genes for each of the annotated clusters. Color scale represents the average level of expression and circle size shows % of cells within each cluster in which expression was detected for each gene. (D & E) Force-Directed Graph showing differentiation trajectories for (D) hematopoietic and (E) stromal compartments, superimposed with expression scores of lineage signature gene sets. (F) Organoid cells projected onto a published dataset of human hematopoietic and stromal cells using the Symphony package (33). See also Suppl. Figs 2 & 3 and Suppl. Tables 1 and 2.

