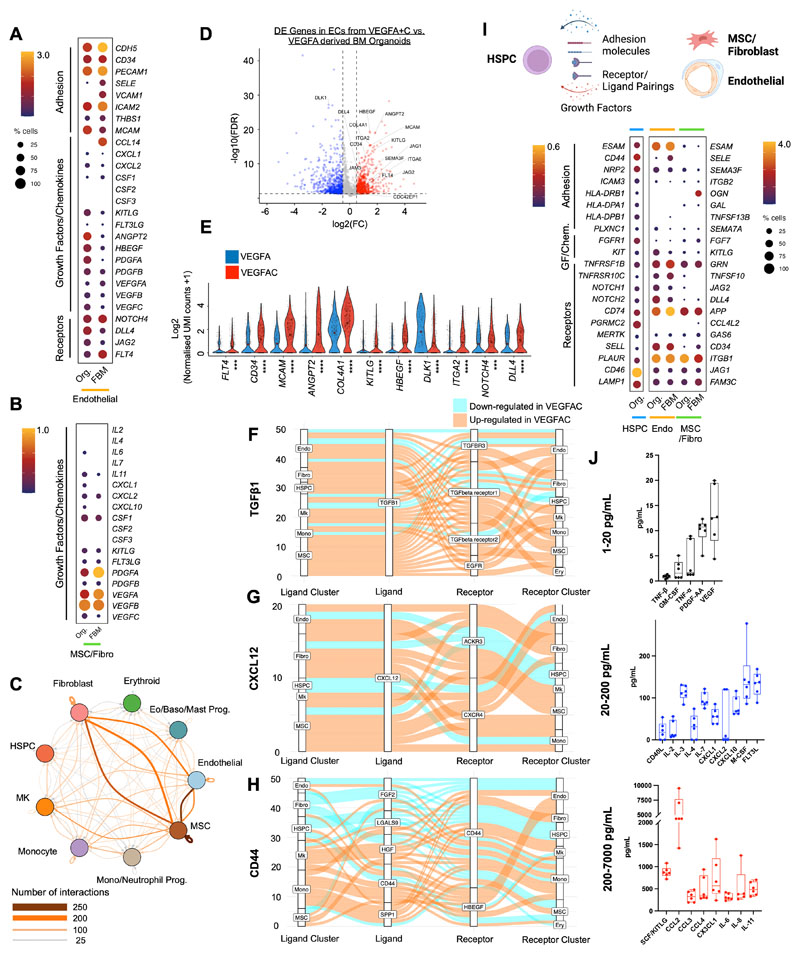
Figure 4. Endothelial, fibroblasts and mesenchymal stromal cells from organoid stroma support hematopoiesis, with increased hematopoietic support from VEGFA+C stimulated vasculature.
(A) Comparison of expression of key receptors, adhesion proteins, growth factors and chemokines in endothelial cells from bone marrow organoids (Org) and human fetal bone marrow (FBM). (B) Comparison of expression of growth factors and chemokines in mesenchymal stromal cells (MSCs) from organoids and FBM. Size of dots represents % of expressing cells and color density indicates level of expression. (C) Total predicted ligand receptor interactions across clusters as predicted by CellPhoneDB (V2.0) showing extensive autocrine and paracrine interactions across BM organoid. (D) Volcano plot showing significantly differentially expressed (DE) genes in endothelial cells (ECs) from VEGFA+C vs. VEGFA-only organoids (801 significantly up- and 700 significantly down-regulated genes, p < 0.05, log2FC > 0.5 or -0.5). (E) Violin plots showing key hematopoietic support factors and markers of bone marrow sinusoidal endothelium in ECs of VEGFA+C and VEGFA-only organoids. P values indicated below x-axis labels and mean value is indicated on violin plots. *** p < 0.001, **** p < 0.0001 for pairwise comparison Wilcox test applied [FDR]). (F, G, H) Sankey plots comparing (F) TGFβ1; (G) CXCL12 and (H) CD44-mediated interactions in VEGFA+C vs. VEGFA stimulated organoids. (I) Expression of interacting receptorligand pairs between organoid hematopoietic stem/progenitor cells (HSPCs) and cognate partner in organoid or FBM endothelial cells (endo) and MSC/fibroblasts, with percent of expressing cells and level of expression shown. (J) Hematopoietic cytokines/growth factors produced by bone marrow organoids, measured by Luminex assay. Each data point represents supernatant pooled from 16 separately generated organoids. See also Suppl. Figs. 4, 5, 6 & 7.

