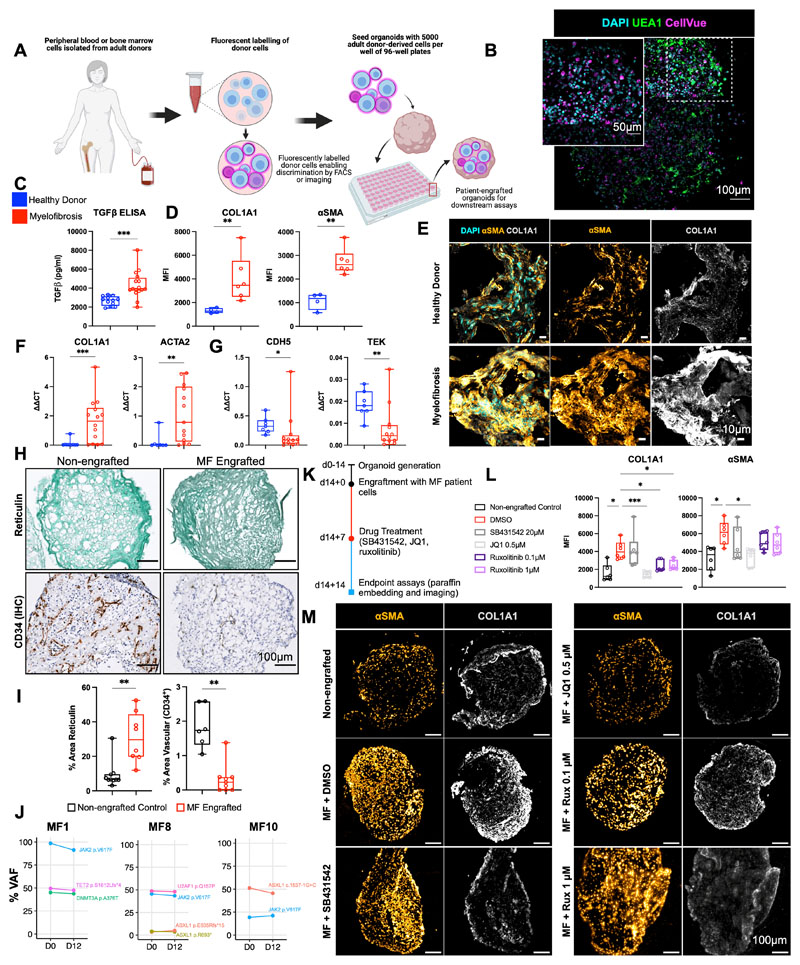
Figure 6. Engraftment of cells from patients with myelofibrosis, but not healthy donors, results in organoid ‘niche remodelling’ and fibrosis.
(A) Cryopreserved peripheral blood or bone marrow cells from healthy donors and patients with blood cancers were fluorescently labelled and 5000 donor cells seeded into each well of a 96-well plate containing individual organoids. (B) Maximum-intensity projection of confocal Z-stack of a whole engrafted organoid 72 hours after seeding of the wells with donor cells, indicating donor cells engrafted throughout the volume of the organoids. (C) Soluble TGFβ in organoids engrafted by cells from myelofibrosis patients and controls. (D, E, F,G) Comparison of organoids engrafted with healthy donor and myelofibrosis cells for (D) collagen 1 (COL1A1) and αSMA immunofluorescence and (E) representative images; (F) Col1A1 and ACTA2 gene expression; (G) CDH5 and TIE2 expression. (* p < 0.01, ** p < 0.05, *** p < 0.001 for Mann-Whitney test, n = 4 healthy donors; n = 7 MF samples for qRT PCR, n = 4 healthy donors; n = 6 MF samples for imaging and quantification of cryo-sections). (H, I) Increased reticulin deposition with concomitant reduction in vascular area in organoids engrafted with myelofibrosis cells vs. non-engrafted control organoids with paired T-tests, each data corresponds to a single organoid engrafted with cells from 3 donors. (J) Variant allele frequencies of mutations detected by NGS of cells from myelofibrosis patients before seeding in organoids (day 0) compared to cells isolated by flow cytometry 12 days after culture in organoids, indicating maintenance of clonal architecture. (K) Workflow for organoid generation, engraftment with cells from myelofibrosis (MF) patients and treatment with inhibitors. (L) αSMA and collagen 1 expression in non-engrafted organoids, and organoids engrafted with myelofibrosis cells treated with DMSO (control), SB431542, JQ1, and Ruxolitinib. Each data point corresponds to total measurements per organoid within a block (n=3 donors). One-Way ANOVA with multiple comparisons (Fisher’s LSD). (M) Representative images from (L). Schematic in (A) created on Biorender.com. * p < 0.01, ** p < 0.05, *** p < 0.001. See also Suppl. Fig. 8.

