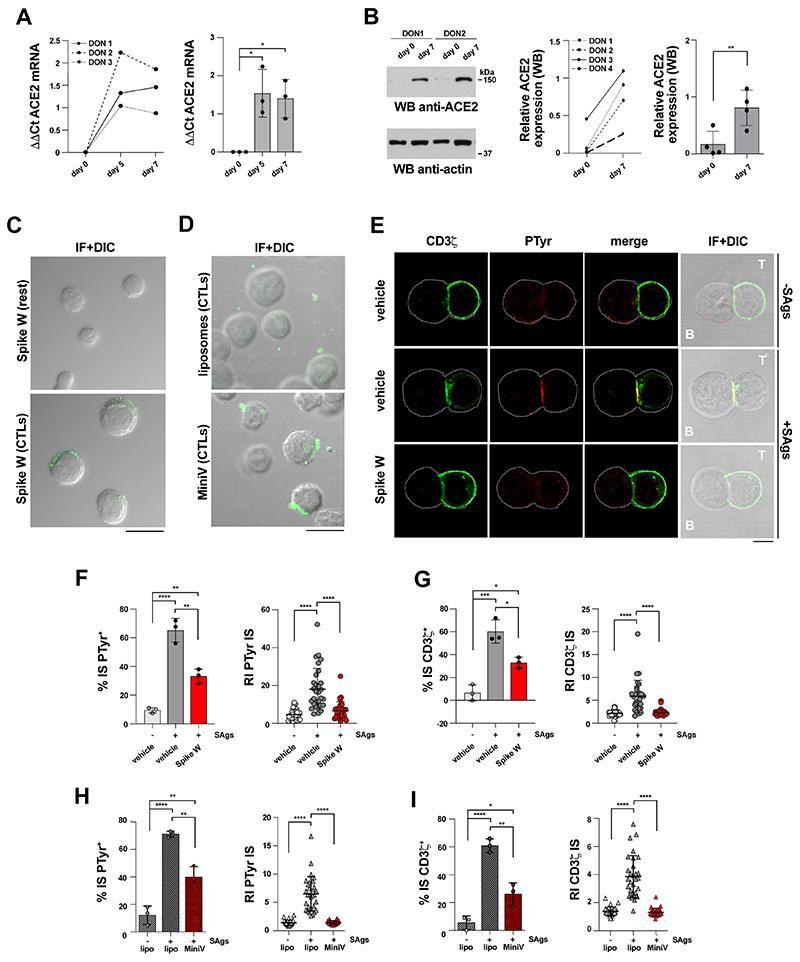
Figure 1. Spike suppresses TCR accumulation and phosphotyrosine signaling at the CTL IS.
A,B. Quantitative RT-PCR of human ACE2 mRNA (A) and immunoblot analysis of human ACE2 protein (B) in purified CD8+ T cells prior to stimulation (day 0) or after stimulation with anti-CD3/CD28 mAb-coated beads in the presence of IL-2 for the indicated times. The migration of molecular mass markers is indicated. (n=3, One-way ANOVA test for qRT-PCR analysis, *p≤0.05; n=4, paired two-tailed Student’s t-test for immunoblot analysis, **p≤0.01). C. Immunofluorescence analysis of Spike W binding to purified CD8+ T cells prior to stimulation (day 0) or 7 days after stimulation with anti-CD3/CD28 mAb-coated beads in the presence of IL-2 (n=2). Size bar, 15 μm. D. Immunofluorescence analysis of CTL binding of fluorescently labeled MiniVs (Spike W embedded in fluorescent NDP-labelled liposomes) or control liposomes. Representative images are shown (n=2). Size bar, 15 μm. E-G. Immunofluorescence analysis of CD3ζ and PTyr in CTLs (day 7) pre-treated with either vehicle (PBS) or 0.05μg/μl Spike Wuhan (Spike W; cell viability after pre-treatment 91.7±0.2%), mixed with Raji cells (APCs) either unpulsed or pulsed with a combination of SEA, SEB and SEE (SAgs), and incubated for 15 min at 37°C. Representative images (medial optical sections) of the T cell:APC conjugates are shown (E). Size bar, 5 μm. F. Left,Quantification (%) of 15-min SAg-specific conjugates harboring PTyr staining at the IS (≥50 cells/sample, n=3, One-way ANOVA test, ****p≤0.0001; **p≤0.01). Right,Relative PTyr fluorescence intensity at the IS (recruitment index) (10 cells/sample, n=3, Kruskal-Wallis test, ****p≤0.0001). G. Left, Quantification (%) of 15-min SAgspecific conjugates harboring CD3ζ staining at the IS (≥50 cells/sample, n=3, Oneway ANOVA test, *** p≤0.001; *p≤0.05). Right, Relative CD3ζ fluorescence intensity at the IS (recruitment index) (10 cells/sample, n=3, Kruskal-Wallis test, ****p≤0.0001). H,I. Immunofluorescence analysis of CD3ζ and PTyr in CTLs (day 7) pre-treated with either 1.2×10⁹ control liposomes or MiniVs, mixed with Raji cells (APCs) either unpulsed or pulsed with a combination of SEA, SEB and SEE (SAgs), and incubated for 15 min at 37°C. H. Left, Quantification (%) of 15-min SAg-specific conjugates harboring PTyr staining at the IS (≥50 cells/sample, n=3, One-way ANOVA test, ****p≤0.0001; **p≤0.01). Right, Relative PTyr fluorescence intensity at the IS (recruitment index) (10 cells/sample, n=3, Kruskal-Wallis test, ****p≤0.0001). Side-by-side comparison of PTyr+ immune synapses formed by CTLS pre-treated with the same amount of soluble and MiniV-associated Spike showed a ~2.3-fold increase in the suppressive ability of Spike when associated to MiniVs (51% vs 22%, n=3). I. Left,Quantification (%) of 15-min SAg-specific conjugates harboring CD3ζ staining at the IS (≥50 cells/sample, n=3, One-way ANOVA test, ****p≤0.0001; **p≤0.01; *p≤0.05.). Right, Relative CD3ζ fluorescence intensity at the IS (recruitment index) (10 cells/sample, n=3, Kruskal-Wallis test, ****p≤0.0001). Non-significant differences are not shown. Source data are available for this figure: SourceData F1

