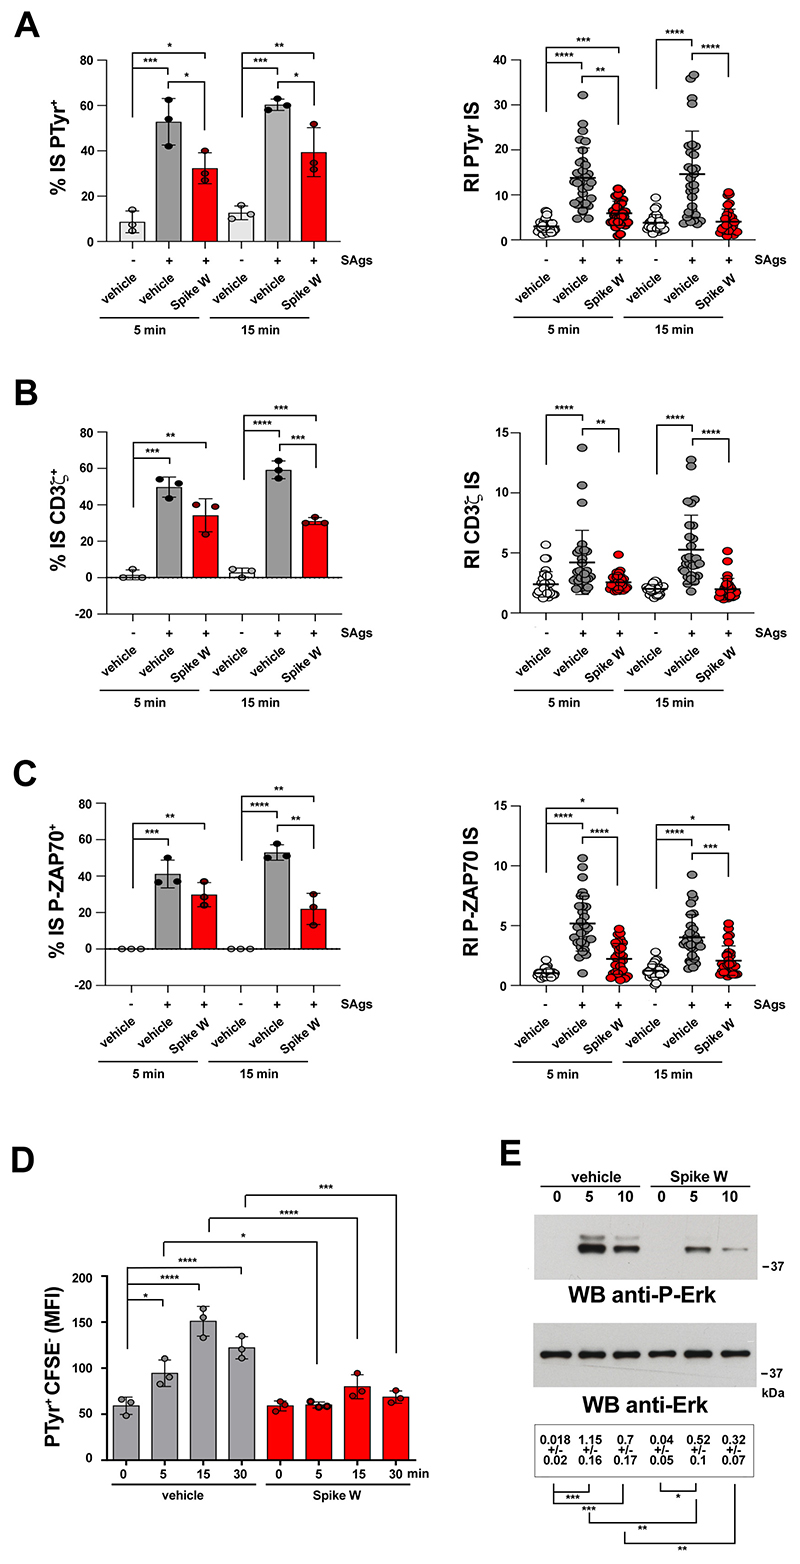
Figure 2. Spike suppresses signaling at an early step of IS assembly.
A-C. Left, Quantification (%) of 5-min and 15-min SAg-specific conjugates harboring PTyr (A), CD3ζ (B), or P-ZAP-70 (C) staining at the IS in CTLs (day 7) pre-treated with either vehicle (PBS) or 0.05μg/μl Spike Wuhan (Spike W), then mixed with Raji cells (APCs) either unpulsed or pulsed with a combination of SEA, SEB and SEE (SAgs), and incubated for 5 or 15 min at 37°C (≥50 cells/sample, n=3, One-way ANOVA test, ****p≤0.0001; *** p≤0.001; **p≤0.01; *p≤0.05). Right, Relative PTyr (A), CD3ζ (B), or P-ZAP-70 (C) fluorescence intensity at the IS (recruitment index) (10 cells/sample, n=3, Kruskal-Wallis test, ****p≤0.0001; *** p≤0.001; **p≤0.01; *p≤0.05). D. Flow cytometric analysis of protein tyrosine phosphorylation in conjugates prepared as in (A-C) and incubated at 37°C for the indicated times. Raji cells were loaded with 1.5 μM CFSE prior to conjugate formation. Conjugates were stained with anti-PTyr mAb followed by fluorescently labelled secondary Abs. The analysis was carried out gating on CSFE-cells (n=3, One-way ANOVA test, ****p≤0.0001; *** p≤0.001; *p≤0.05). E. Immunoblot analysis of Erk phosphorylation in CTLs activated with anti-CD3 and anti-CD28 mAbs. CTLs were incubated at 37°C for the indicated times and processed for immunoblot with antibodies against the active forms of Erk1/2. Stripped filters were blotted with anti-Erk2 mAb as loading control. The migration of molecular mass markers is indicated (n=2, One-way ANOVA test, *** p≤0.001; **p≤0.01; *p≤0.05). Data are expressed as mean±SD. ****p≤0.0001; *** p≤0.001; **p≤0.01; *p≤0.05. Non-significant differences are not shown. Source data are available for this figure: SourceData F1

