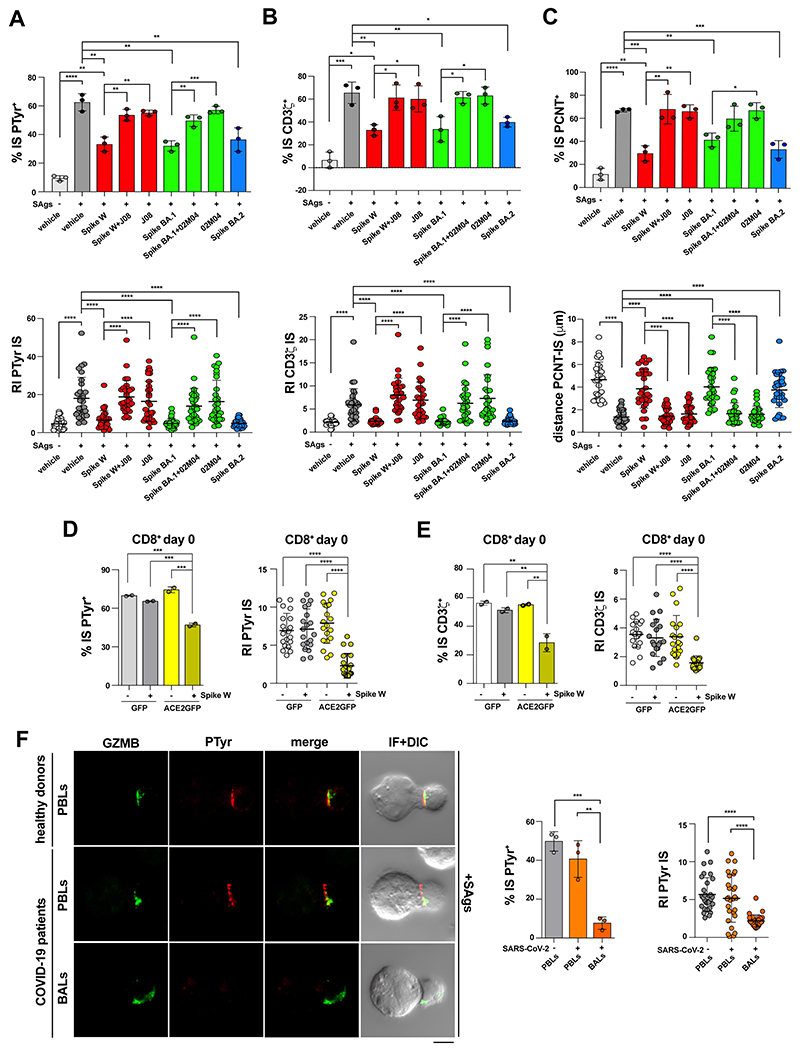
Figure 4. The inhibitory effects of Spike on IS formation are mediated by ACE2 and can be detected in acutely infected SARS-CoV-2 patients.
A,B. Top, Quantification (%) of 15-min antigen-specific conjugates harboring PTyr (A) or CD3ζ (B) staining at the IS in CTLs (day 7) pre-treated with either vehicle (PBS) or 0.05μg/μl Spike Wuhan (Spike W), Spike Omicron BA.1 (Spike BA.1), alone or in the presence of the respective neutralizing mAb (Spike W+J08; Spike BA.1+02M04); or Spike Omicron BA.2 (Spike BA.2). Samples pre-treated with only the neutralizing mAbs (J08 and 02M04) were also included in the analysis. CTLs were mixed with Raji cells (APCs), either unpulsed or pulsed with a combination of SEA, SEB and SEE (SAgs), and incubated for 15 min at 37°C (≥50 cells/sample, n=3, unpaired two-tailed Student’s t-test, ****p≤0.0001; *** p≤0.001; **p≤0.01; *p≤0.05). Bottom, Relative PTyr (A) or CD3ζ(B) fluorescence intensity at the IS (recruitment index) (10 cells/sample, n=3, Kruskal-Wallis test, ****p≤0.0001). C. Top, Quantification (%) of 15-min antigen-specific conjugates formed as in panel A harboring PCTN1 staining at the IS (≥50 cells/sample, n=3, One-way ANOVA test, ****p≤0.0001; *** p≤0.001; **p≤0.01; *p≤0.05). Bottom, Measurement of the distance (μm) of the centrosome (PCNT) from the T cell-APC contact site (10 cells/sample, n=3, Kruskal-Wallis test, ****p≤0.0001). D,E. Immunofluorescence analysis of PTyr (D) and CD3ζ (E) in purified CD8+ T cells transfected with an ACE2-GFP-expressing construct or empty vector, pre-treated with either vehicle (PBS) or 0.05 μg/μl Spike Wuhan (Spike W), then mixed with Raji cells (APCs) either unpulsed or pulsed with a combination of SEA, SEB and SEE (SAgs), and incubated for 15 min at 37°C. The histograms show (left) the quantification (%) of conjugates harboring PTyr (D) and CD3ζ(E) staining at the IS (top) (≥50 cells/sample, n=2, One-way ANOVA test, *** p≤0.001; **p≤0.01), or (right) the relative PTyr (D) and CD3ζ (E) fluorescence intensity at the IS (recruitment index) (10 cells/sample, n=2, Kruskal-Wallis test, ****p≤0.0001). Quantification was carried out on GFP+ cells. F. Immunofluorescence analysis of PTyr and GrzB in BALs or PBLs from patients with acute SARS-CoV-2 infection, or PBLs from healthy donors, mixed with Raji cells (APCs) pulsed with a combination of SEA, SEB and SEE (SAgs), and incubated for 15 min at 37°C. Representative images (medial optical sections) of the T cell:APC conjugates are shown. The histograms show (left) the quantification (%) of 15-min SAg-specific conjugates harboring PTyr staining at the IS (≥50 cells/sample, n=3, One-way ANOVA test, *** p≤0.001; **p≤0.01), or (right) the relative PTyr fluorescence intensity at the IS (recruitment index) (10 cells/sample, n=3, Kruskal-Wallis test, ****p≤0.0001). The analysis was restricted to CTLs, identified by GrzB staining. Data are expressed as mean±SD. Non-significant differences are not shown. Size bar, 5 μm.

