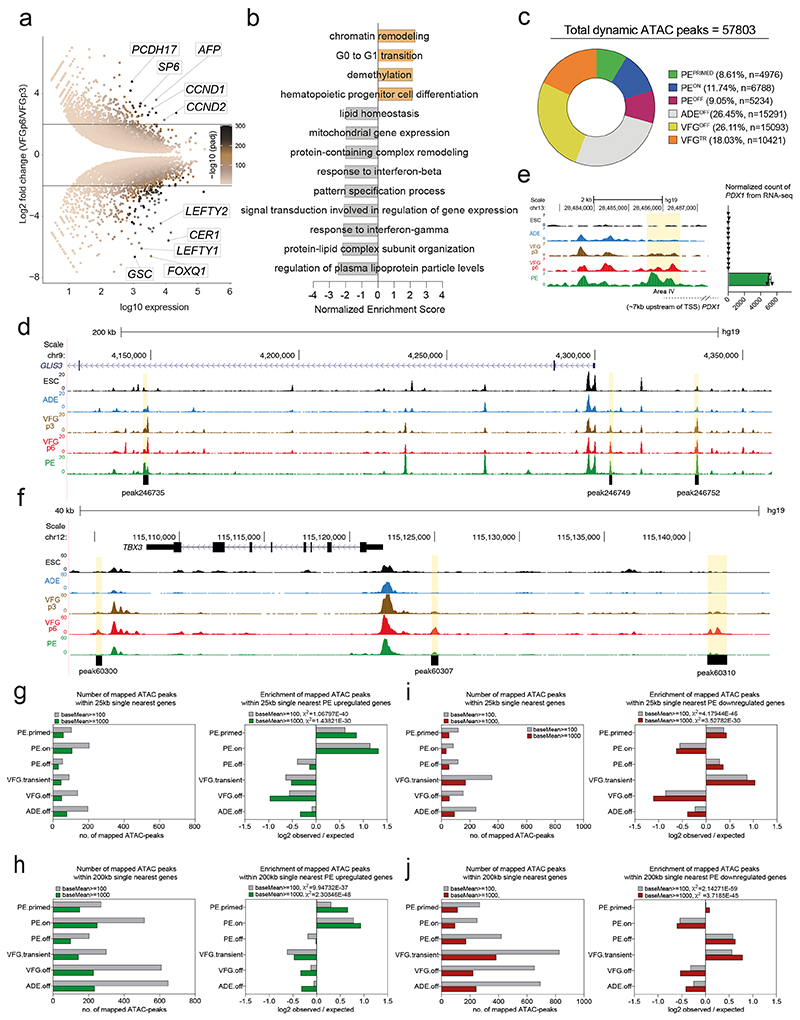
Extended Data Fig. 4. The dynamic chromatin landscape and gene expression in VFG expansion and further differentiation.
a, MA-plot representing differential expression in VFGp6 versus VFGp3 culture (Log2 fold change > 2, P < 0.05) (N=3 independent experiments). b, GSEA for GO-BP of VFGp6 compared to VFGp3 cells. Normalized Enrichment Score for significant terms for VFGp6 are shown as positive value, and VFGp3 as negative value (FDR <0.05). c, Pie-chart showing distribution of dynamic ATAC-peaks (n=57803) with percentage and numbers of peak indicated per cluster in Fig. 3c. d, Representative UCSC Genome Browser screen shot (from two independent experiments) at the GLIS3 locus showing ATAC-seq data from ESC, ADE, VFGp3, VFGp6, and PE. Genome coordinates (bp) are from the hg19 assembly of the human genome. PEPRIMED elements (peaks 246735, 246749, and 246752) are shown at the bottom and the corresponding regions are highlighted in yellow. e, Left: Representative UCSC Genome Browser screen shot as in d. The region of the area IV enhancer is highlighted in yellow. Approximate distance between the region and PDX1 TSS is indicated by a broken dashed line. Right: bar plots for expression (normalized RNA-seq counts, N=3 independent experiments) for PDX1 RNA across the same samples as ATAC-seq. f, Representative UCSC Genome Browser screen shot at the TBX3 locus as in d. VFGTR elements (peaks 60300, 60307, and 60310) are shown at the bottom and the corresponding regions are highlighted in yellow. g-h, Mapping dynamic enhancer classes to gene expression (up-regulated genes). Left: Number of mapped ATAC peaks in each cluster defined in Fig. 3c located within 25 Kb (g) or 200 Kb (h) of the single nearest gene’s TSS from the PE up-regulated gene set with baseMean >100 (grey) or >1000 (green). Right: Enrichment (log2 observed/expected) of the PE up-regulated gene set with baseMean > 100 (grey) or >1000 (green), in proximity (within a 25 or 200 Kb window) to ATAC-clusters defined in Fig. 3c. i-j, Mapping dynamic enhancer classes to gene expression (down-regulated genes) for elements located within 25 Kb (i) or 200 Kb (j) of the single nearest gene’s TSS from the PE down-regulated gene set, analysis and labels as in g. All data shown are significant by chi-square analysis.

