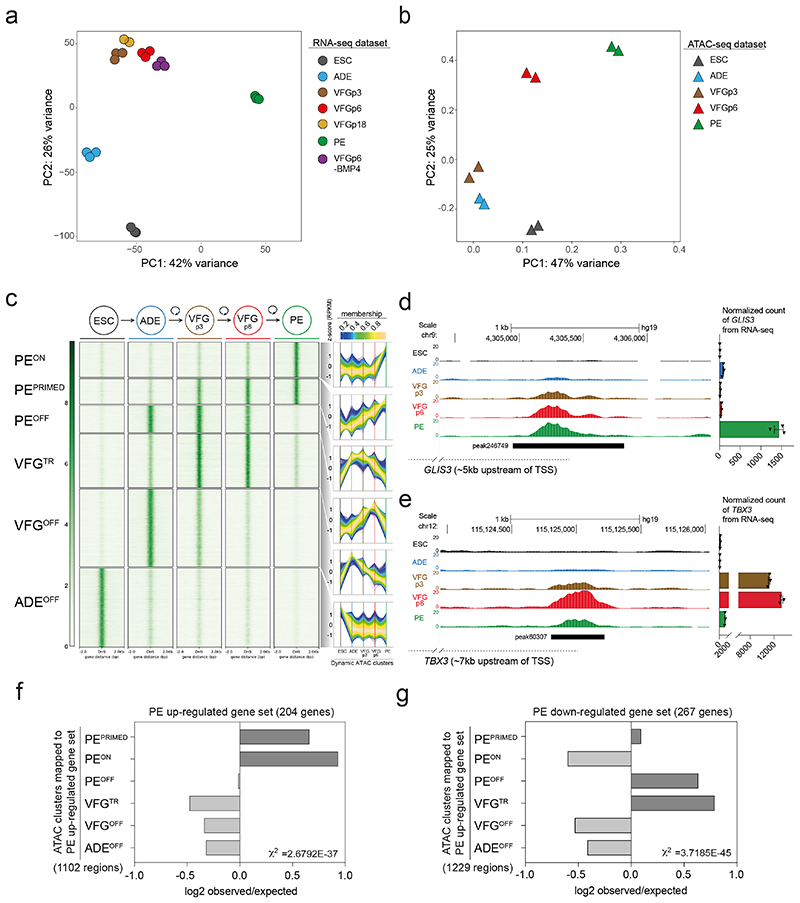
Fig. 3. Dynamic chromatin accessibility and gene expression during VFG expansion and pancreatic differentiation.
a, Principle component analysis (PCA) based on top 2000 differentially expressed genes in bulk RNA-seq dataset (from three or two (VFGp18) independent experiments) of ESC, transient ADE and VFG cells (at p3, 6, and 18), VFG cells without BMP (at p6) and PE cells generated from VFGp6 cells. b, PCA of ATAC-seq dataset (from two independent experiments) for ESC, transient ADE and VFG cells (at p3, 6). c, Left: Heatmaps of the normalized ATAC-seq signal for the dynamic clusters identified by fuzzy clustering. Right: Time course-sequencing (TCseq) trajectories for each cluster. Membership score reflects how well a given enhancer follows the pattern identified in time course analysis. d-e, Left: Representative UCSC Genome Browser screen shot (from two independent experiments) at the GLIS3 (d) and TBX3 (e) locus showing ATAC-seq data from ESC, ADE, VFGp3, VFGp6 and PE. Genome coordinates (bp) are from the hg19 assembly of the human genome. The PEPRIMED regulatory element (peak246749) (d) and VFGTR element (peak60307) (e) are shown with a black bar. Approximate distance between the element and the respective TSS is indicated by a broken dashed line in each panel. Right: RNA-seq data (normalized read count) for GLIS3 (d) and TBX3 (e) across the same conditions as the ATAC tracks. RNA-seq data are represented as mean ± SEM (N=3 independent experiments). f-g, Bar plot showing enrichment scores (log2 observed/expected) of ATAC peak sets found within a 200 Kb window from genes upregulated (f) or downregulated (g) between PE and VFGp6 across the defined ATAC peak clusters. Genes considered here had a base mean expression > 1000, log2 fold change > 1.5 and adjusted P<0.05. For annotation see Supplementary Table 1, d-g. Analysis using lower base mean (100) or reduced genomic window sizes (25 Kb) are shown in Extended Data Fig. 3, g-j. All data shown are significant using chi-square analysis.

