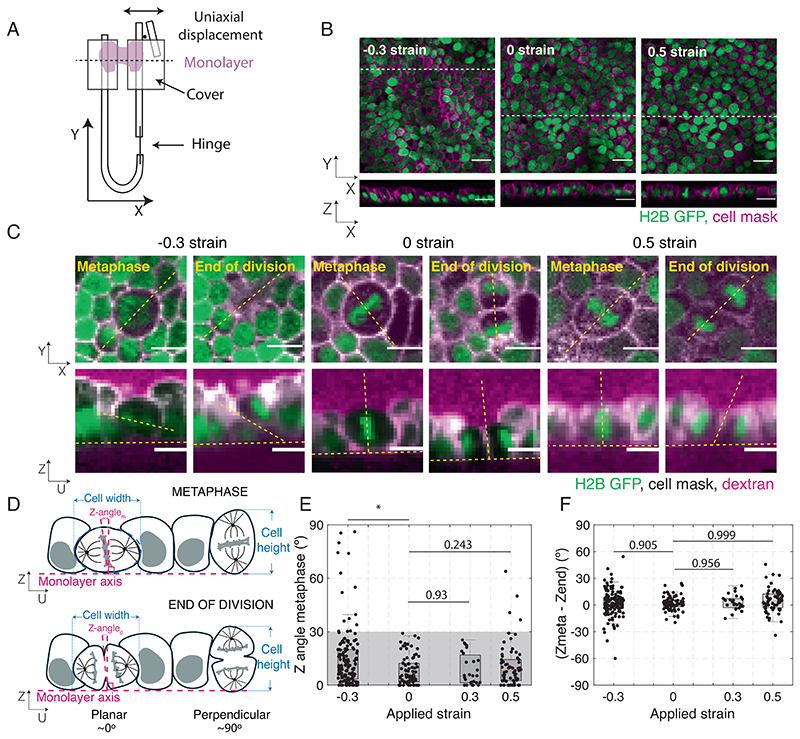
Fig. 1. Application of uniaxial compressive strain to epithelial monolayers promotes division out-of-plane.
(A) Diagram of the device for mechanical manipulation of suspended MDCK monolayers. The U-shaped device consists of a rigid arm and a flexible arm. Small cover glasses (gray) are glued to the extremities of each arm creating a gap of ~500 μm. A drop of collagen is then polymerized in this gap, and cells are seeded on top of it. Once the cells form a monolayer spanning the gap (magenta), the collagen is removed by enzymatic digestion leaving the monolayer suspended between the two plates. Uniaxial strain can be applied to the monolayer by displacing the flexible arm with a motorized manipulator. (B) Representative images of suspended MDCK cell monolayers subjected to different strains along the X-axis viewed in the XY (Top) and XZ (Bottom) planes. The strain to which the monolayer was subjected is indicated in the Top Left corner. Nuclei are marked with H2B GFP (green) and cell membrane with CellMask (magenta). Dashed white lines indicate the planes at which the XZ profiles were taken. (Scale bar: 10 μm.) (C) Examples of cell divisions in MDCK monolayers subjected to different strains viewed in the XY (Top) and UZ (Bottom) planes. Each cell is shown at metaphase and at the end of cytokinesis. Nuclei are marked with H2B GFP (green), cell membranes are visualized with CellMask (white), and Alexa Fluor 647 dextran (magenta) is added to the medium to allow visualization of the cell outlines. For each cell, the orientation of the spindle defines a UV referential with the U-axis oriented along the pole-to-pole axis (dashed yellow lines) and the V-axis along the metaphase plate (SI Appendix, Fig. S1A). Profile views were taken along the UZ axis. In the profile views, the horizontal yellow dashed lines indicate the plane of the monolayer, while the slanted and vertical dashed lines indicate the orientation of the metaphase plate or the division furrow. (Scale bar: 10 μm.) (D) Diagram of the spindle and division orientation measurements in the UZ plane. The spindle Z-angle at metaphase (Z-anglem) was calculated as the angle between the line passing through the metaphase plate and the line perpendicular to the monolayer plane. Similarly, the spindle Z-angle at the end of division (Z-angled) was calculated as the angle between the line passing through the closed cytokinetic furrow and the line perpendicular to the monolayer plane. (E) Distribution of spindle Z-angles at metaphase (Z-anglem) for different applied strains. Gray shaded area highlights Z-angles <30°. The number of mitotic cells examined for each condition was N = 147 for –30% strain, N = 81 for 0% strain, N = 27 for 30% strain, and N = 68 for 50% strain. Experiments were performed on n = 14 independent days for –30% strain, n = 8 independent days for 0% strain, n = 4 independent days for 30% strain, and n = 8 independent days for 50% strain. The P-value compared with 0% strain was P = 0.003 for –30% strain, P = 0.93 for 30% strain, and P = 0.243 for 50% strain. (F) Difference between spindle Z-angles at the beginning of metaphase and the end of division for each applied strain. The data correspond to the same experiments as in (E). Distributions were compared with 0 with a Z-test. The P value was P = 0.965 for –30% strain, P = 0.992 for 0% strain, P = 0.956 for 30% strain, and P = 0.999 for 50% strain. (E and F) Box plots indicate the 25th and 75th percentiles, the red line indicates the median, and the whiskers extend to the most extreme data points that are not outliers. Individual data points are indicated by black dots.

