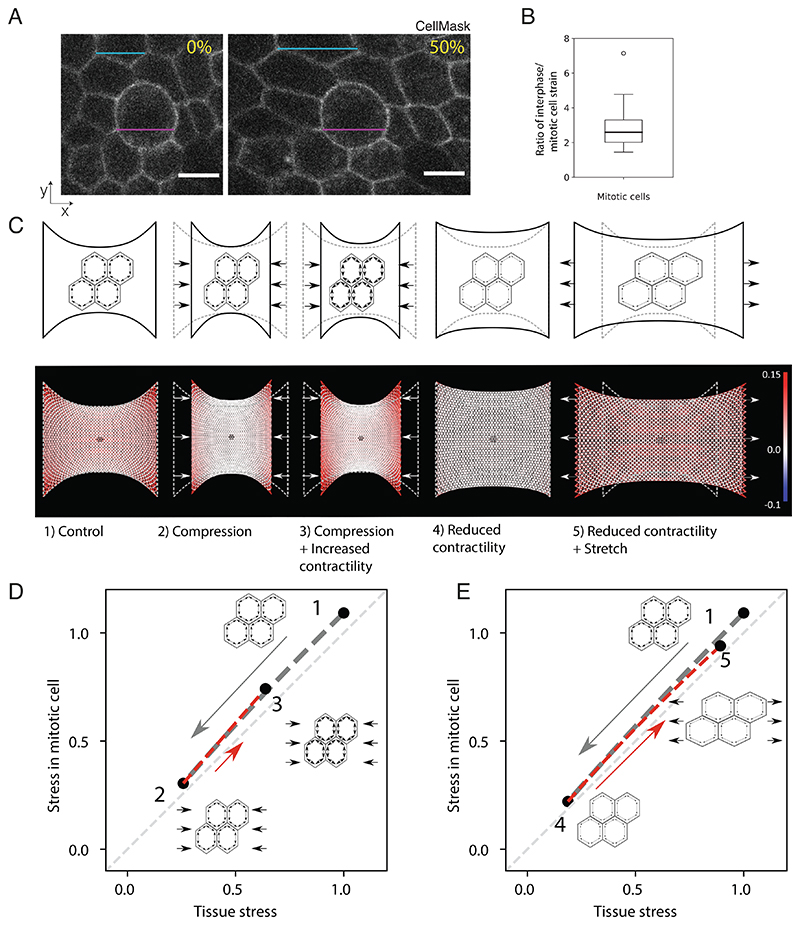
Fig. 4. Mechanical stress at the tissue-scale reflects the mechanical environment of interphase and mitotic cells in response to chemical and mechanical manipulations.
(A) Representative images of mitotic cells in a monolayer subjected to 0% strain and 50% strain. The magenta lines denote the length of the mitotic cell in both images, while the blue lines show the length of an interphase cell in both conditions. Cells are labeled with CellMask membrane stain. (Scale bars: 10 μm.) (B) Ratio of interphase cell strain to mitotic cell strain, calculated from the cyclical stretching experiments with an amplitude of ~50% shown in panel A. Strain calculated from measurements of the bounding box of the respective cell before and after a stretch is applied to the monolayer. Eleven mitotic cells were measured from 11 different monolayers. Mean strain in interphase cells is calculated from the strain in three interphase neighboring cells that do not have any junction in common with the mitotic cell of interest. The distribution’s median, first and third quartiles, and range are represented by the central bar, bounding box, and whiskers, respectively. An outlier is represented by a dot. (C) Finite element model predictions of the stress distributions in monolayers subjected to mechanical and chemical manipulations. Top: schematic representation of the experimental conditions: 1) a monolayer in its initial configuration clamped at both ends (0% strain) and subjected to a tensile stress arising due to cell contractility; 2) a monolayer subjected to a –30% compressive strain applied by displacing the test rods; 3) a monolayer subjected to a –30% compressive strain and treated with a drug increasing cell contractility (calyculin); 4) a monolayer at 0% strain treated with a drug decreasing cell contractility (Y27632); 5) a monolayer treated with a drug decreasing cell contractility and subjected to a 50% tensile strain. Bottom: Stress distribution within the monolayer. The mesh representing the monolayer is color coded to display the stress in each element with red colors representing tensile stress, blue colors compressive stress, and white colors regions of low stress. A mitotic cell simulated as a stiffer inclusion is present in the center of the monolayer (dark region). Stress distributions are presented for the experimental conditions depicted above. (D) Stress in a mitotic cell in the center of a monolayer as a function of the stress in the tissue in response to compressive strain followed by a chemical treatment to increase contractility. In the monolayer’s initial configuration, the stress on the mitotic cell is approximately equal to the tissue stress (state 1, corresponding to condition 1 in panel C). When a compressive strain is applied to the monolayer, the stress in the mitotic cell decreases in proportion to the decrease in the tissue stress (gray dashed line, transition from state 1 to 2 in panel C – gray arrow). Increasing prestress in the cells by increasing myosin contractility by calyculin treatment leads to a partial recovery of the tensile stress in the tissue and the mitotic cell (red dashed line, transition from state 2 to 3 in panel C – red arrow). All stresses are normalized to the tissue stress in state 1. (E) Stress in a mitotic cell in the center of a monolayer as a function of the stress in the tissue in response to a chemical treatment to decrease contractility followed by application of a tensile strain. In the monolayer’s initial configuration, the stress on the mitotic cell is approximately equal to the tissue stress (state 1, corresponding to condition 1 in panel C). When a chemical treatment that decreases cellular prestress is applied, the stress in the tissue and the cell drops to values close to 0 (gray dashed line, transition to state 4 in panel C – gray arrow). To recover a stress similar to condition 1, a 50% stretch is applied to the monolayer (red dashed line, transition from state 4 to 5 in panel C – red arrow). All stresses are normalized to the tissue stress in state 1.

