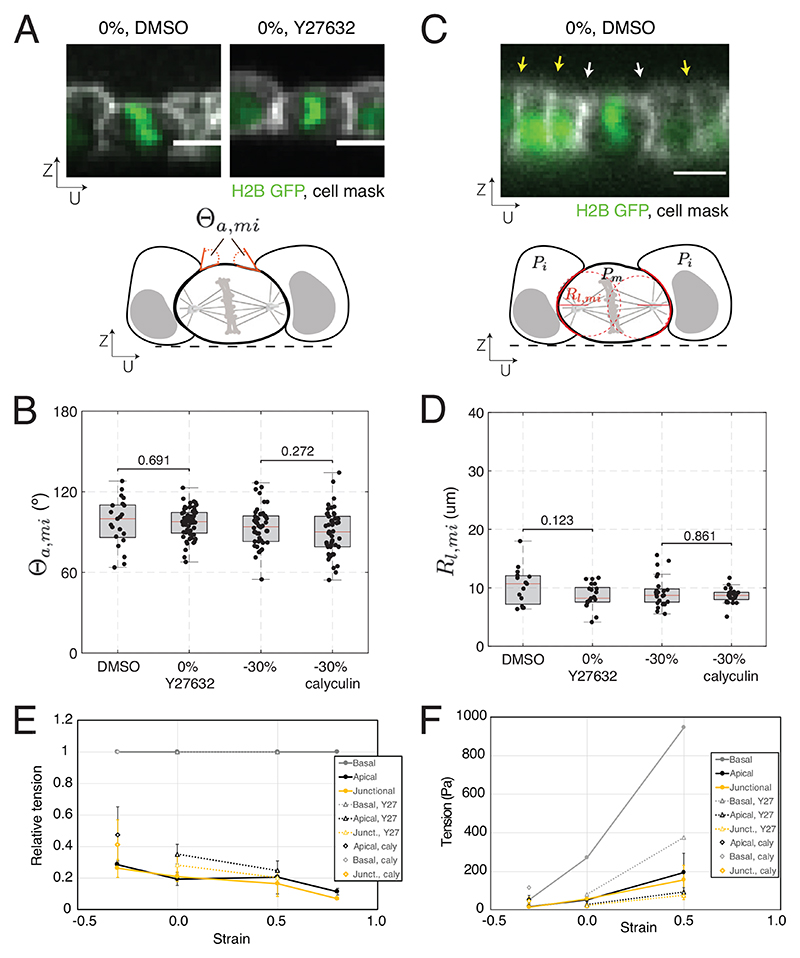
Fig. 5.
Treatments that modulate tissue tension have identical effects on the surface tension of interphase and mitotic cells. (B, D) Box plots indicate the 25th and 75th percentiles, the red line indicates the median, and the whiskers extend to the most extreme data points that are not outliers. Individual data points are indicated by black dots. (A, C) (Scale bars: 10 μm.) (A) Top: Representative profile of a dividing cell surrounded by interphase neighboring cells within a monolayer at 0% strain, treated with DMSO or Y27632. Nucleic acids are visualized by H2B GFP (green), the cell membrane is labeled with CellMask 568 dye (white). Bottom: Diagram indicating the apical angle of contact between the mitotic cell and its interphase neighboring cells, Θa,mi. (B) Distribution of apical angles of contact between dividing cells and their interphase neighbors at 0% strain, measured in monolayers treated with DMSO or Y27632, and at –30% compression, measured in control monolayers or monolayers treated with calyculin. DMSO vs. Y27632: WRST, P = 0.691; N = 19 cells, DMSO; N = 60 cells, Y27632; n = 4 independent days, DMSO; n = 8 independent days, Y27632. –30% compression vs. –30% compression with calyculin: WRST, P = 0.272; N = 30 cells, –30% compression; N = 22 cells, –30% compression with calyculin; n = 14 independent days, –30% compression; n = 2 independent days, –30% compression with calyculin. (C) Top: Representative profile of a dividing cell surrounded by its interphase neighboring cells within a monolayer at 0% strain, treated with DMSO. Yellow arrows indicate intercellular junctions between interphase cells, and white arrows indicate intercellular junctions between the mitotic and interphase cells. Nucleic acids are visualized by H2B GFP (green), the cell membrane is labeled with CellMask 568 dye (white). Bottom: Diagram indicating measurement of the lateral radii of curvature of mitotic cells (red dashed lines). (D) Distribution of lateral radii of curvature for dividing cells in monolayers at 0% strain, treated with DMSO or Y27632, and at –30% compression, measured in control monolayers or monolayers treated with calyculin. DMSO vs. Y27632: WRST, P = 0.123; N = 15 cells, DMSO; N = 21 cells, Y27632; n = 4 independent days, DMSO; n = 8 independent days, Y27632. –30% compression vs. –30% compression with calyculin: WRST, P = 0.861; N = 21 cells, –30% compression; N = 21 cells, –30% compression with calyculin; n = 14 independent days, –30% compression; n = 2 independent days, –30% compression with calyculin. (E) Relative surface tension in the apical, basal, and junctional surfaces as a function of strain for control monolayers, monolayers treated with Y27632, and monolayers treated with calyculin. Surface tensions are normalized to the basal tension for each strain magnitude. The error bar is the SD of the surface tension (calculated as the mean of 10 cells per monolayer). (F) Absolute surface tension as a function of strain for apical, basal, and junctional surfaces for control, monolayers treated with Y27632, and monolayers treated with calyculin. Basal tension is taken equal to the monolayer tension (Fig. 3C), and apical and junctional tensions are calculated using panel E. The error bar is the SD of the surface tension (calculated as mean of 10 cells per monolayer).

