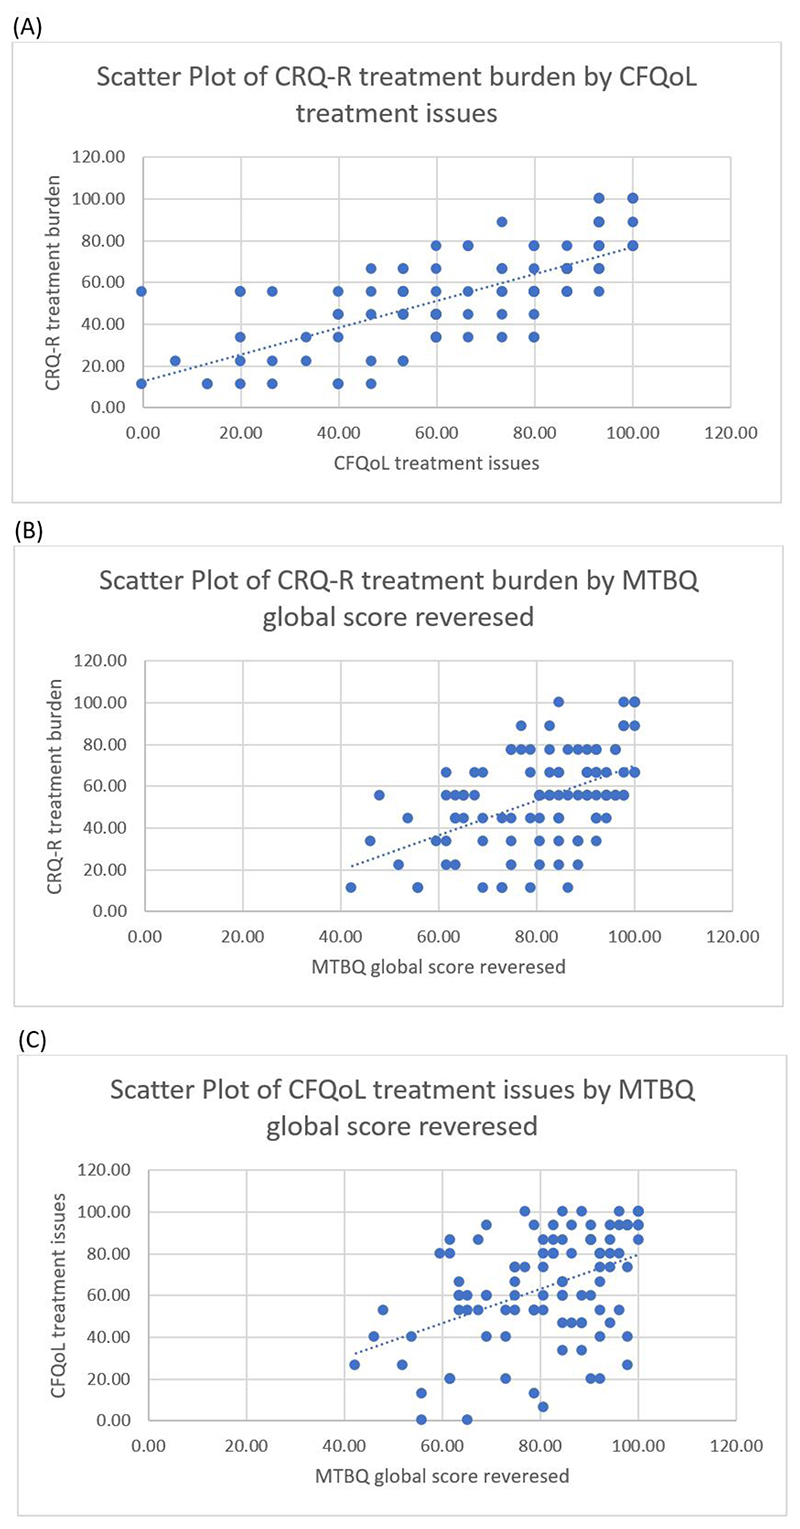
Figure 1. Scatter plots for the correlations between the three treatment burden instruments.
(A) the correlation between the CFQoL and the CFQ-R treatment burden subscales. (B) the correlation between the CFQ-R treatment burden subscale and the MTBQ. (C) the correlation between the CFQoL treatment burden subscale and the MTBQ.

