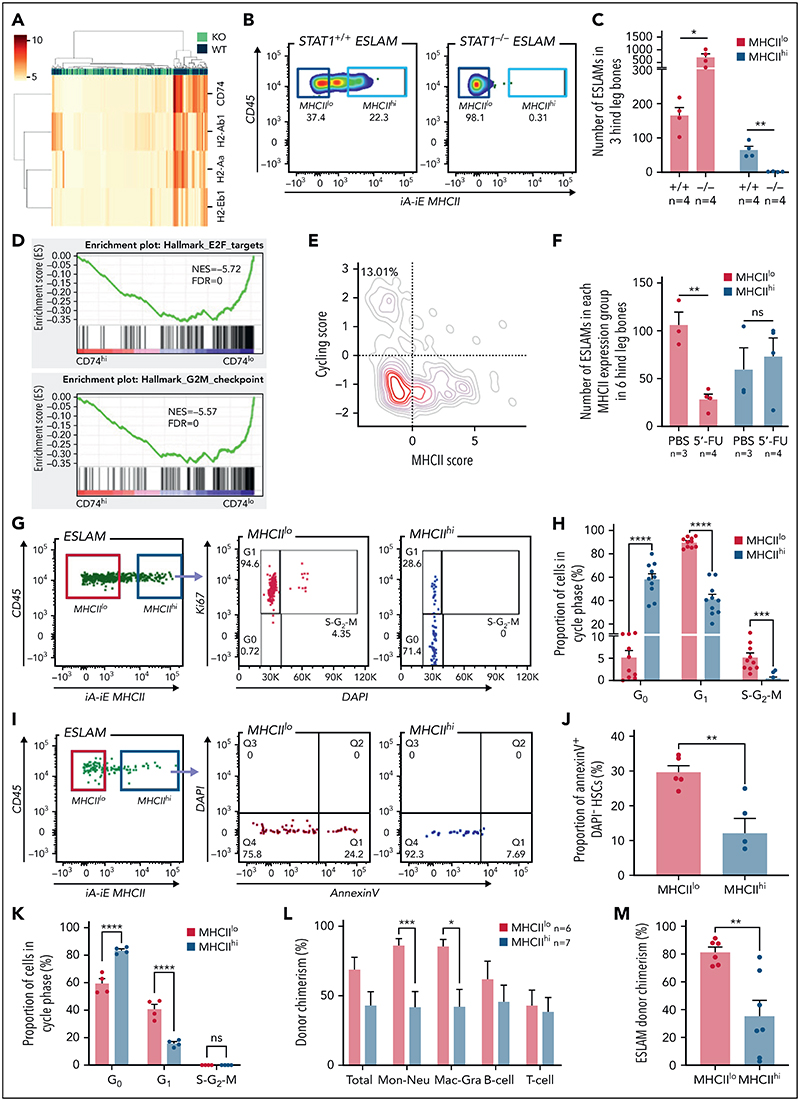
Figure 5. STAT1 maintains MHCII expression in a subset of HSCs (MHCIIhi) that are refractory to myeloablation.
(A) Heatmap showing MHCII gene expression and hierarchical clustering of ESLAM HSCsfrom STAT1KO and WT mice. (B) Representative flow cytometry plots showing MHCII expression on cell surface of HSCs, which was lost in STAT1-deficient ESLAM HSCs. (C) Bar graph showing the subsetof HSCswith high surface expression (MHCIIhi) was completely lost in STAT1-deficient mice. (D) GSEA plots showing a depletion of cell cycle signatures in CD74hi LT-HSCs. (E) LT-HSCs with low MHCII scores tended to display higher cycling scores. LT-HSCs from Nestorowa scRNA-seq dataset were analyzed. (F) Bar graph showing the subset of HSCs with low surface expression (MHCIIlo) are preferentially depleted following a single dose of 5-FU treatment (150 mg/Kg). Flow cytometric analysis was performed on BMMNCs at 43 hours post-injection. (G) Representative flow cytometry plots showing cycling status for MHCIIhi andMHCIIlo HSCs following 5-FU treatment. (H) Bar graphs showing MHCIIhi HSCs display reduced cycling in response to 5-FU. (I) Representative flow cytometry plots showing apoptosis status for MHCIIhi and MHCIIlo HSCs following 5-FU treatment. (J) Bar graphs showing MHCIIhi HSCs displayed reduced apoptosis in response to 5-FU. (K) Bar graphs showing MHCIIhi HSCs display reduced cycling in response to polyinosinic–polycytidylic acid at 16 hours post-treatment. (L) Bar graphs showing donor chimerisms in peripheral blood at 16 weeks post-transplantation as analyzed in Figure 2. (M) Bar graphs showing reduced donor-derived ESLAM HSC chimerisms in recipient bone marrow at 16weeks post-transplantation. Data are shown as mean ± standard error; asterisks indicate significant differences by Student t test (****P < .0001; ***P <.001;**P <.01;*P < .05). FDR, false discovery rate; iA-iE, MHCII antibody; NES, normalized enrichment score; ns, not significant.

